The Main Technical Analysis Indicators
Technical analysis has long established itself as a powerful tool for traders seeking to understand and predict price movements. But what indicators are really important for analyzing cryptocurrency markets? In this article, we’ll take a look at the best technical analysis indicators that will help you make informed decisions in the face of high crypto volatility in the market.

Trade cryptocurrencies on WhiteBIT!
Technical Analysis Indicators Explained
Technical analysis is a method of predicting future prices of financial instruments (such as stocks, currencies, cryptocurrencies) based on the analysis of past market data, mainly prices and trading volumes. This approach is based on the assumption that all the necessary information for making trading decisions is already embedded in price charts, and that the history of price movements tends to repeat itself.

Indicators in market indicators in technical analysis are tools that help traders interpret market data and make decisions. They are mathematical calculations based on prices and trading volumes and can be displayed in the form of graphs or lines superimposed on a price chart. Indicators help to identify trends, find pivot points, detect overbought or oversold levels, and other important signals.
Indicators are used for several reasons:
- Trend Determination: Indicators such as moving averages help traders determine the direction of the current trend, whether it is up, down or sideways.
- Finding Entry and Exit Points: Oscillators such as RSI (Relative Strength Index) can show when the market is overbought or oversold, helping to identify good times to buy or sell.
- Signal Confirmation: Indicators are often used to confirm signals obtained by other methods of analysis, which reduces the risk of false market entries.
- Analyzing market dynamics: Indicators such as MACD (Moving Average Convergence/Divergence) help traders understand the strength and speed of trend changes, which is important for decision-making.
- Risk Management: Indicators can be used to better assess market conditions and make decisions that minimize risk and increase the likelihood of trading success.

Types of Indicators in Technical Analysis
Technical analysis and indicators for beginners includes a wide range of indicators, each of which provides unique data for assessing market conditions. All indicators can be divided into trend indicators of technical analysis and oscillators.
Trend indicators
Moving Averages are one of the simplest and most widely used indicators that smooth price data to help traders see a trend.
- Simple Moving Average (SMA): The SMA is calculated by averaging prices over a certain period of time. For example, a 50-day SMA will average the last 50 days. This indicator helps to determine the overall trend and is used to identify support and resistance levels.
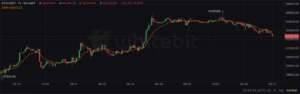
Simple Moving Average. Source: whitebit.com
- Exponential Moving Average (EMA): Unlike the SMA, the EMA gives more weight to recent prices, making it more sensitive to recent changes. This allows you to react faster to trend changes, which is important for short-term traders.
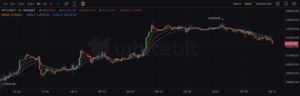
Exponential Moving Average. Source: whitebit.com
- MACD (Moving Average Convergence Divergence) is a trend indicator that shows the relationship between two moving averages — usually the 12-day EMA and the 26-day EMA. When the MACD crosses its signal line (the 9-day EMA), it can indicate a potential trend change. It is also important to pay attention to divergences — when price is moving in one direction and the MACD is moving in another, it can signal a potential reversal.
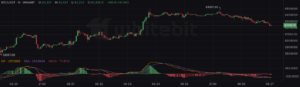
MACD. Source: whitebit.com

Oscillators
- Bollinger Bands is a volatility indicator. It consists of three lines: the middle line and two outer bands, which are located at a distance of two standard deviations from the middle line. These bands widen and narrow depending on the volatility of the market. When the price approaches the upper or lower band, it can signal an overbought or oversold market, respectively.
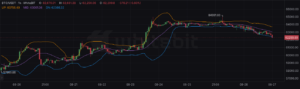
Bollinger Bands. Source: whitebit.com
- The Relative Strength Index (RSI) is an oscillator that measures the speed and change in price movements. It ranges between 0 and 100 and is commonly used to determine overbought (above 70) and oversold (below 30) levels. When the RSI rises above 70, it may indicate that the asset is overbought and a correction may follow.
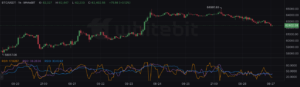
RSI. Source: whitebit.com
- The Stochastic Oscillator is another oscillator that helps to identify whether an asset is overbought or oversold. It compares the current closing price to a range of prices over a certain period of time. Like the RSI, the Stochastic Oscillator oscillates between 0 and 100, with values above 80 indicating overbought and below 20 indicating oversold.
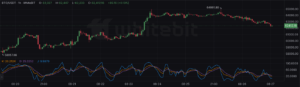
Stochastic Indicator. Source: whitebit.com
There are other additional signal confirmation tools such as Volume. This is an important indicator technical analysis that shows the number of shares or contracts traded over a period of time. High volumes in a price movement indicate the strength of that movement, while low volumes may indicate weakness in the trend. Studying volumes helps traders to confirm or deny the signals received from other technical indicators in technical analysis.
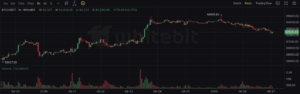
Technical analysis volume indicators. Source: whitebit.com
In practice, many traders combine technical analysis indicators and oscillators to obtain more accurate signals and analyze market data. Using modern analytical platforms such as Trading View helps visualize these indicators and integrate them into trading strategies, making the decision-making process more informed and efficient.

Pros and Cons of Market Indicators in Technical Analysis
Technical analysis figure indicators provide traders with important tools for interpreting market data and predicting future price movements. The main advantages of indicators are their ability to simplify complex market data, making it more understandable and easy to analyze. Trend indicators help to determine the direction of a trend, which is especially useful for long-term investors. Oscillators, in turn, allow identifying overbought and oversold points, which gives traders the opportunity to enter into transactions at the most favorable moments. In addition, indicators help minimize subjectivity, allowing decisions to be made based on clear mathematical calculations.
However, technical analysis indicators also have their disadvantages. One of the main disadvantages is their lagging nature — many indicators are based on past data, which can lead to late signals, especially in rapidly changing market conditions. In addition, indicators can give false signals, especially during periods of low volatility or in markets with no discernible trend. Overuse of indicators can also overload the chart and hinder decision-making, especially if different indicators contradict each other. It is important for traders to remember that indicators are just tools that should be used in combination with other methods of analysis and good market intuition. Even the best technical analysis indicator will not give a trader a guaranteed result.
Current Cryptocurrency Rates
Conclusion
Learning and applying the basic indicators of technical analysis is an important step towards successful trading. These tools help you see patterns and sentiment hidden in numbers and charts. However, to make truly informed decisions, you must also consider fundamental aspects such as economic data, political events and new funds. Fundamental analysis combined with technical analysis allows traders to adapt to the ever-changing market and react to unexpected events with minimal losses.