Fibonacci Retracement Levels

Cryptocurrency traders face new challenges and opportunities every day. And the arsenal of technical analysis tools plays one of the critical roles. One of them deserves special attention — Fibonacci Retracement levels — a concept taken from a mathematical sequence that has found its application in the cryptocurrency market.
This term may sound complicated, but it has become integral to many traders’ strategies. Fibonacci retracement (or Fib) helps you understand how and why markets move in specific cycles, providing clues about potential price reversal points. Before we learn more about this tool, let’s know where it came from, its basic principles, and why it is essential to successful trading.
What Is Fibonacci Retracement in Trading?
Fibonacci is a tool, a grid of numbers that act as support or resistance levels for the price. Fibonacci is an essential tool both for entering a position and for analyzing the location of the cost in different intervals of movement within a particular trend. Trade cryptocurrency can be much more successful using this method.
The principle of Fibonacci retracement is to calculate key percentage levels, often points where market prices can stabilize or even change direction after a sharp rise or fall.
Fibonacci Sequence in Simple Words
The Fibonacci retracement numbers begin with 0 and 1, with each successive number representing the sum of the previous two. This produces a series such as 0, 1, 1, 2, 3, 5, 8, 13, 21, etc.
This mathematical sequence finds its application in many fields, including technical crypto market analysis. Trade Fibonacci retracement used in trading relies on key percentage levels such as 38.2%, 50%, 61.8%, and 78.6% to identify potential support and resistance points based on the profound mathematical principles embedded in this sequence. Graphically, the ratio is displayed in the dimension from 0 to 1, respectively, 0.382, 0.5, 0.618, 0.786.
What is the Fibonacci Retracement Golden Ratio?
The golden ratio, or 0.618 or 61.8%, is critical in various fields, including math, art, and nature.
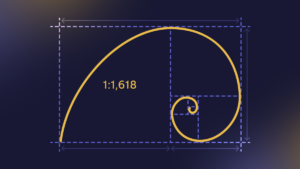
However, with the advent of the stock and cryptocurrency market, the Golden Ratio has also found its application in technical analysis. Investors and traders use the Golden Ratio to identify levels at which the price may experience a correction and change direction.
For example, if the price of an asset has been moving upward and has reached a specific high, 61.8% may serve as one of the correction target levels. This can warn traders of a possible trend reversal from this level and help them make appropriate decisions to buy or sell the asset.
The fundamental rule is to build a Fibonacci grid according to the market structure. The best time frame for Fibonacci retracement is when the grid is stretched between the points of the structure (high and low). The two points are labeled 1 and 0. When determining an upward correction, the grid is stretched from the minimum to the maximum, and vice versa when choosing a downward correction.
Many traders using Fibonacci retracement levels believe that:
- 23.6% and 76.4% are relatively reliable levels;
- 38.2% and 50% corrections are more reliable;
- 61.8% of corrections are considered the most reliable and are called the “golden ratio.”
How to Draw Fibonacci Retracement Indicator?
Fibonacci retracement crypto lines are drawn on a cryptocurrency price chart to identify potential support and resistance levels based on predetermined percentages from the Fibonacci sequence. Here’s how it’s done:
- Selecting significant points: pick two important points on the price chart: the high and low of a significant price movement. For an uptrend, the starting point will be the low, and the ending will be the high. For a downtrend Fibonacci retracement, the starting point will be increased, and the ending point will be low.
- Drawing Fibonacci retracement: draw a line from the start point to the endpoint. The tool will automatically calculate and display the Fibonacci levels between these two points. Percentage levels will be automatically shown between the start and endpoints. Each level will represent a horizontal line on the chart.
Remember, Fibonacci tools do not provide exact predictions but suggest areas to look out for. Effective use of these lines requires combining them with other forms of analysis, such as trend lines, indicators, and patterns.
Alert Zones in Fibonacci Retracement Chart
Support
Support levels on a trading Fibonacci retracementchart are horizontal lines that indicate the level where the market supports the price, preventing it from falling lower. These levels are often seen as a “floor” for asset prices where buying interest increases, stopping the price from falling further. In the context of a Fibonacci retracement, if the cost of an asset declines and then approaches a level Fibonacci retracement (e.g., 61.8%), this can indicate potential support where traders can consider entering a position or buying.
Resistance
Resistance levels also look like horizontal lines on a chart, but they indicate where the market resists the price, preventing it from rising further. These levels can be considered a price ceiling, where selling interest increases, limiting the price rise. In a Fibonacci retracement explained, if the price of an asset rises and approaches one of the Fibonacci percentage levels, this can signal a resistance zone where traders may consider closing their positions or selling.
How to Use Fibonacci Retracement Tool?
Fibonacci levels in trading are used to identify potential support and resistance levels, with traders selecting significant lows and highs on the chart for an uptrend or downtrend, respectively, and using the retracement Fibonacci tool to create horizontal lines at key percentage levels (23.6%, 38.2%, 50%, 61.8%, 78.6%). These levels are used to identify entry and exit points and set orders to lock in profits or limit losses, and it is recommended to combine them with other technical analysis tools and always apply risk management strategies. Effective use of the best Fibonacci retracement levels requires practice and experience, and their use may vary depending on market conditions.
Stop-Loss and Take-Profit orders are placed at strategic levels and help traders maximize profits and minimize losses by providing disciplined risk management when entering and exiting market positions.