Find New Trading Opportunities Thanks to TradingView Advanced Chart on WhiteBIT
TradingView is a technical analysis platform and social network that provides traders and investors with robust charting and analysis tools: stock screener and economic calendar among others. The platform offers a wide range of features designed to help users analyze financial markets, identify trading opportunities and make informed trading decisions.
Using TradingView tools on our exchange, you can analyze the current market situation faster and more effectively, having access to all the necessary analysis tools on the WhiteBIT chart.
TradingView Advanced Chart on WhiteBIT
The integration of TradingView with WhiteBIT provides access to numerous indicators and functions that can be used on the chart directly in the application or the web version of the exchange.
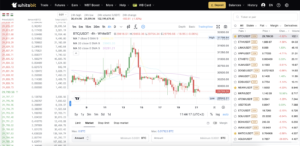
TradingView chart on WhiteBIT
Thanks to TradingView, traders on the exchange can use the following tools:
1. An extended drawing panel. It is hidden under the blue arrow (if the dark theme is off) or the yellow arrow (if the dark theme is on) at the bottom left of the trading chart. Open it, and you’ll be able to:
- Change the appearance of the cursor on the chart to your liking, or erase what has already been drawn with an eraser;
- Draw complex geometric shapes. In total, more than 90 drawing tools are available, including Fibonacci levels (fib retracement), various patterns, simple geometric shapes, lines, curves, etc.;
- Write text and use emojis, which, together with the drawing tools, will come in handy when creating your own notes on the chart. If you want to hide everything drawn, click on the eye icon.
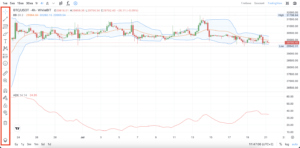
The drawing panel on the TradingView trading chart on WhiteBIT (highlighted by a red rectangle)
2. Adjust the appearance of the price chart according to your preferences. Thanks to the integration, you can choose from 8 display types (from candlesticks to heikin ashi) of the trading charts. You can change the colors of the candles and the background, set the display of indicators, date format, and timeframe.
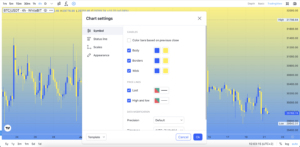
Charts appearance settings
3. Select from over 100 of the most popular technical indicators that will simplify the process of price movement analysis by customizing their values according to your needs. You will find RSI (Relative Strength Index), MACD (Convergence/Divergence of Moving Averages), 8 types of moving averages (MA), Bollinger Bands, etc. You can select the indicator by clicking the Fx icon next to the Candles icon responsible for price chart display types.
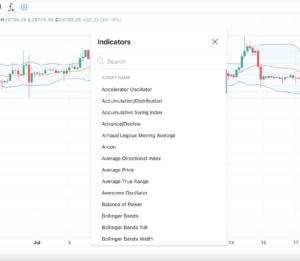
Indicators menu
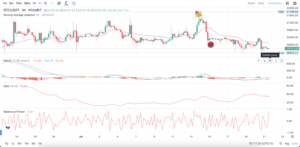
After selecting the desired indicator, it is immediately applied to the price chart and displayed over it, such as Bollinger Bands, or below it, such as MACD. You can apply several indicators at once. The screenshot below shows the chart with applied MACD, Balance of Power (BoP), and Average Directional Index (ADX).
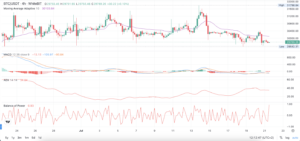
Indicators on WhiteBIT’s price chart
There is a layer icon at the bottom of the drawing toolbar. You can see all the indicators applied to the chart by clicking on it and quickly view, delete, or hide them.
4. The chart also has a full-screen mode, and you can hide any indicator, the price curve itself, or change the arrangement of elements (for example, group indicators below and above the price curve for convenience). The control panel is present for each item on the chart on the top-right next to the asset price scale.
Control panel for displaying and changing the location of elements on the price chart (highlighted by a red rectangle)
5. Extended timeframe. On the basic chart on the exchange, you can see the movement of the asset’s price for a period from 10 seconds to 1 week. With TradingView, you additionally have time intervals from 1 month to 5 years.
The TradingView integration provides access to real-time market data and makes it possible to trade on WhiteBIT without having to switch between platforms.
TradingView chart provides advanced tools for working with the crypto market, such as real-time data, customizable charts, and numerical technical indicators to conduct comprehensive market analysis, make informed trading decisions and optimize your trading strategies.