What is Crypto Technical Analysis? How to Analyze Price Movements in the Cryptocurrency Market?

Technical Analysis, or TA, is a method of studying financial markets, including the cryptocurrency market, through analyzing and interpreting historical price data.
TA is based on the assumption that the history of price movements can aid in forecasting future market trends and global patterns. Unlike fundamental analysis, which involves studying economic indicators or company news, technical analysts focus on price and specific chart patterns.
TA helps maintain disciplined trading and overcome emotions — the primary challenge for all traders. Emotions often take the lead once you start executing actual trades, pushing rationality into the background.
So, how to you perform trading crypto technical analysis? What are its advantages and disadvantages? Find out more in this article.
History of Technical Analysis
Technical Analysis has a rich history predating the advent of digital currencies, originating from the work of Japanese rice traders in the 18th –19th centuries. They developed a method of analyzing candlestick charts, which remains a crucial tool for market analysis.
Over time, this method adapted to various market needs, including stocks, commodities, and, eventually, the cryptocurrency market. A significant development in its evolution is associated with Charles Dow, a renowned American journalist and founder of The Wall Street Journal.
While working as a journalist, Charles Dow systematically studied financial markets and their movements. He observed that assets and markets don’t behave randomly; instead, they often follow specific trends and behavior patterns. These observations led to the creation of the “Dow Theory.”
The Dow Theory asserts that asset prices already include all necessary information for decision-making, implying that the price reflects all available information. Everything known about a company, the economy, or broader societal factors is already factored into the price. Dow also identified three market trends:
- Primary Movements: Major market trends that can persist for a year or more, reflecting the overall market direction and condition;
- Secondary Movements: Corrective movements within the primary trend, moving against the primary trend. Their duration typically ranges from weeks to months;
- Minor Movements: Short-term fluctuations lasting from hours to a month, often considered noise in the context of broader trends.
Within this theory, Dow outlined three main phases of the market cycle:
- Accumulation Phase: The initial phase is where experienced investors accumulate assets contrary to general market sentiment. Prices have yet to show significant increases;
- Public Participation or Big Move: Following the accumulation phase, the wider public starts following the trend, leading to a substantial price movement;
- Distribution Phase: In this phase, those who entered the trend early begin to take profits and exit positions.
Dow’s theory also involves working with indicators like moving averages to determine trend direction and strength. His approach emphasizes the importance of reversal patterns. Trends persist until a clear reversal signal appears. According to Dow’s theory, it remains effective until a definite reversal sign emerges.
In summary, Dow’s theory is a cornerstone of TA, providing a foundation for understanding the movement of any market and investor behavior. Despite being formulated over a century ago, its focus on trends, tendencies, and price action remains relevant and forms the basis of modern crypto technical analysis.

Technical Analysis of Crypto: Basics
The goal of cryptocurrency analysis is to predict future price movements and identify entry and exit points in the market. TA principles assume that price movement information contains all the necessary data for making trading decisions, and prices move in specific trends that can be explored and identified.
How Does Technical Analysis Work?
Crypto technical analysis for beginners can be complex; it’s indeed a whole science. Describing the mechanics of technical analysis in action can be challenging, but we can highlight several key steps typically followed by professional traders:
- Data Collection: Analysts gather historical data on the prices of a specific asset at various timeframes (TF). This is often done using websites displaying the price movement history, either on the crypto exchange or on platforms like TradingView;
- Charts: The data is analyzed and presented as price candlestick charts, line charts, or other graphical representations. This step is crucial, providing a maximum amount of input for analysis. The chart allows for the examination of the current trend, medium-term/short-term trends, etc.;
- Indicators: Analysts use technical indicators to identify signals for buying or selling an asset. Examples include Moving Averages, which help smooth price dynamics and highlight trends. Simple Moving Average (SMA) and Exponential Moving Average (EMA) are common. The Relative Strength Index (RSI) assesses price speed and changes, indicating overbought or oversold conditions. Others, like Moving Average Convergence Divergence (MACD) and Bollinger Bands, are also used;
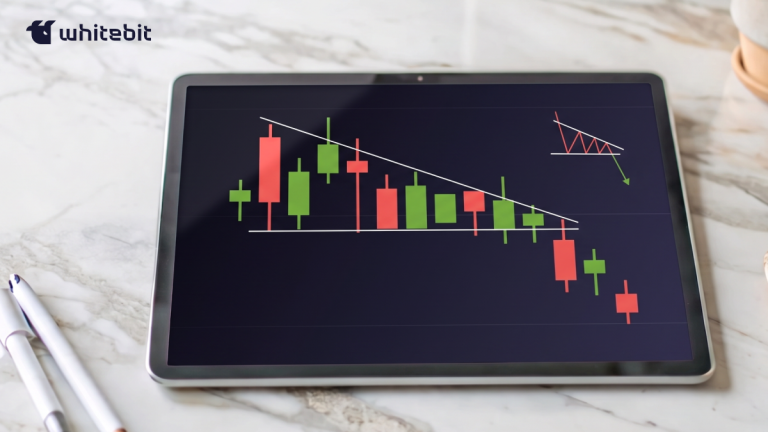
- Patterns: Analysts evaluate characteristic graphical patterns, such as head and shoulders, triangles, double tops, flags, etc., which may indicate future market trends;
- Forecast: Based on data analysis and tools, technical analysts try to predict future price movements and decide about entering or exiting the market. Sometimes, analysts use a combination of technical and fundamental analysis, providing additional insights into the project behind the asset.
For instance, Bitcoin and crypto technical analysis are multifaceted approaches requiring in-depth exploration of various factors. Attention is primarily given to graphical patterns on the chart. Additionally, fundamental changes play a significant role, including updates to regulatory frameworks, technological advancements, and shifts in investor sentiment. Combining chart analysis with understanding essential factors allows traders and investors to gain a more comprehensive view of cryptocurrency market dynamics and make more informed decisions.
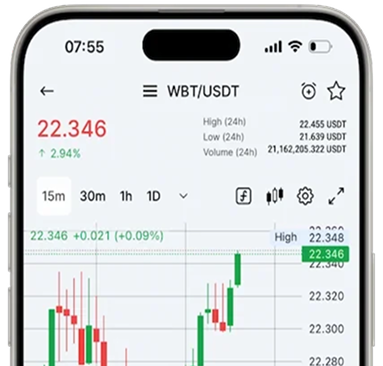
On WhiteBIT, you can track crypto prices movements, receive real-time data, and analyze market trends.
However, it’s essential to understand that none of this data guarantees success. Technical analysis in trading relies on historical data, and past results do not guarantee future success.
Cryptocurrency Trading Using Technical Analysis: Main Features
Technical analysis of cryptocurrencies has its peculiarities due to the unique characteristics of the digital asset market.
Cryptocurrency markets operate 24/7 without breaks on weekends, unlike traditional financial markets. This continuous trading creates opportunities for traders to react to events at any time.
Taking breaks from trading is essential for a trader’s overall well-being when using technical analysis for crypto. Traders are susceptible to stress, especially in highly volatile market conditions. Periodic breaks help reduce stress levels, prevent burnout, and allow traders to step away from the market, review their strategies, and return with a clearer mindset. Self-care and effective time management are key aspects of long-term trading success.
- Cryptocurrencies often exhibit high volatility, offering numerous opportunities for profitable trades but also increasing the risk of losses;
- Some less popular cryptocurrencies may have low liquidity, posing challenges when entering or exiting positions. Traders must exercise caution and consider this factor;
- News and events related to cryptocurrencies can significantly impact prices. Traders actively monitor updates and news on social media to assess their impact on the market. Additionally, fundamental analysis is often employed to evaluate the asset and the project behind it.
What is Technical Analysis in Trading?
Compared to the traditional approach in technical analysis, which focuses on price and trading data, fundamental analysis aims to understand the intrinsic value of an asset. This involves analyzing financial and production indicators, evaluating the company and its reputation, studying market competition, and assessing the industry’s overall condition.
Technical analysis in trading is often used to predict price movements and overall market behavior, while fundamental analysis serves as a method to assess the value of an asset considering its potential and context.
The technical analysis of crypto charts gains popularity among short-term traders aiming to identify opportunities in short-term trends. On the other hand, fundamental analysis is more widespread among investors who evaluate assets with a longer-term perspective.
Why Technical Analysis Faces Criticism: Pros and Cons of TA
Signals on charts can typically be inaccurate, especially in conditions of high volatility expected in digital currencies. Unpredictable price fluctuations make achieving high accuracy in technical analysis for various patterns challenging.
Another aspect is the limited ability of TA to consider fundamental factors. This analysis method relies solely on historical price data while incorporating the psychology of traders, which influences price movements even more than financial indicators, market coefficients, economic forecasts, etc. The technical analysis of crypto is the only way to measure this irrational, emotional component in all markets.
Subjective interpretation of charts is a topic of discussion. Unfortunately, individuals tend to see the market as they wish, not as it truly is. Different scenarios can be seen on the same chart, creating room for conflicting trading decisions.
Technical analysis in crypto can become a self-fulfilling prophecy — predictions indirectly influencing reality in a way that makes them come true. Popular figures and signals start “working” simply because other market participants widely use them, regardless of the actual price movement dynamics.
In reality, the effectiveness of market technical analysis depends on how skillfully a trader or investor can use it. The method’s effectiveness is highly contingent on experience, approach, and the ability to adapt strategies to changing market conditions.
It’s essential to remember that even the most advanced TA does not eliminate risks and does not guarantee successful trades. There is no absolutely reliable approach that predicts market price movements with a 100% probability. Markets are highly complex and influenced by numerous factors, including economic events, geopolitical changes, technological innovations, participant psychology, and many others.
Buy crypto on WhiteBIT