Descending Triangle Pattern In Technical Analysis

Key Points from the Article:
- Descending Triangle – a technical analysis chart pattern most commonly associated with bearish trend continuation.
- Pattern Structure – consists of a horizontal support level and a descending resistance trendline.
- Key Event – a breakout below the support level once the pattern is fully formed.
- Potential Target – measured by the height of the triangle’s base.
- Pattern Characteristic – requires confirmation, as false breakouts may occur.

Cryptocurrency Market Capitalization
What Is Descending Triangle Pattern?
A Descending Triangle is a classic technical analysis pattern most commonly associated with the continuation of a downtrend, although it can also serve as a reversal pattern. It forms as selling pressure intensifies, leaving buyers unable to keep the price above a key support level.
How To Identify A Descending Triangle?
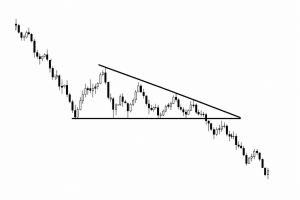
The pattern is defined by two key trendlines:
- Horizontal support – a price level that the market tests multiple times but fails to break lower during the pattern’s formation.
- Descending resistance – a downward-sloping trendline connecting a series of lower highs, reflecting increasing selling pressure.
Visually, the pattern resembles a triangle with a flat base and a descending upper boundary.
How To Trade Triangle Descending Pattern?
Let’s consider the *general principle for working with this pattern in technical analysis:
This material is provided for informational purposes only and should not be considered financial advice, investment advice, or a recommendation to take any action.
Pattern Formation. Traders typically confirm that the pattern has formed by identifying the following characteristics:
- a horizontal support level;
- at least two or three consecutively lower highs;
- price action gradually contracting within the triangle.
As long as the price remains within the pattern, the trading signal is generally considered unconfirmed.
Support Breakout. The classic trading signal occurs when the price closes below the horizontal support level.
Many traders avoid reacting to the initial test of support and instead wait for a confirmed breakout.
Signal Confirmation. To improve the reliability of the pattern, traders often look for additional confirmation, including:
- increased trading volume during the breakout;
- a strong bearish candlestick;
- the absence of a rapid recovery back into the triangle.
In some cases, after the breakout, the price returns to the former support level, which then acts as resistance. This move is known as a retest.
Determining the Potential Price Target. In classical technical analysis, the target is estimated using the height of the triangle’s base.
The calculation is typically performed as follows:
- measure the distance between the pattern’s initial high and the support level;
- project that same distance downward from the breakout point.
Risk Management. Regardless of the trading strategy, market participants typically define in advance:
- the conditions under which the pattern will be considered invalid;
- the point at which the trading idea will be abandoned;
- the level of risk-to-reward they are willing to accept.
This disciplined approach helps reduce emotionally driven decision-making during periods of market volatility.
Trading Strategies For Descending Triangles
The crypto descending triangle is most commonly used in trend-following strategies, where it is regarded as a bearish continuation pattern. It is also widely applied in breakout trading, where a move below the support level is interpreted as a potential trading signal.
The pattern is also a core element of Price Action trading – an approach that focuses on price movement without the use of indicators. Within this framework, traders evaluate the pattern’s structure, candlestick behavior, and the market’s reaction to key support and resistance levels.
Advantages And Disadvantages Of Descending Triangle
Let’s examine the advantages and disadvantages of the descending triangle:
| Potential | Limitations |
| Easy to identify on thechart | False breakouts are possible |
| Provides clearsupport and resistance levels | Requires confirmation of a breakout |
| Commonly found on various time frames | Does not guarantee a continuation of the trend |
| Suitable for trend-following trading | Less reliable in sideways markets |
| Allows you to determine a potential price target in advance | Effectiveness depends on the market context |
Falling Wedge Vs Descending Triangle
The key difference between these patterns lies in the expected direction of the price movement and their overall structure.
A descending triangle chart pattern consists of a horizontal support level and a downward-sloping resistance line. It is most commonly viewed as a bearish continuation pattern, suggesting a potential breakout to the downside.
A Falling Wedge is formed by two converging downward-sloping trendlines, with the upper trendline typically declining at a gentler angle than the lower one. It is generally considered a bullish pattern, often signaling a potential upward reversal or the continuation of an uptrend following a breakout above the upper boundary.
Real-time cryptocurrency rates
Conclusion
The Descending Triangle is a widely used technical analysis pattern that helps traders evaluate the likelihood of a downtrend continuing. However, like any chart pattern, it does not guarantee a specific outcome, and its signals should always be confirmed using additional technical factors.
This material is provided for informational purposes only and should not be considered financial advice, investment advice, or a recommendation to take any action.