What Are Support and Resistance Levels in Bitcoin and Crypto Trading?

Crypto rates reflect market volatility, but understanding the essential technical tools allows traders to adapt and strategically plan their trades. Support and resistance levels are among the most significant and frequently used tools for analyzing cryptocurrency markets. These terms reflect the basic principles of trading and investing and serve as fundamental navigation tools, helping to identify potential reversal or trend continuation points.
This article will help you learn what support and resistance levels are, how to build support and resistance levels properly, and what risks are present in trading with this tool.
What Is Support And Resistance?
Identifying support and resistance involves recognizing price thresholds in the market where an asset often stops or changes direction due to a significant amount of buying or selling.
Support Level
A support level is a price below an asset that usually does not fall. This is because demand prevails oversupply at this level, creating a “cushion” that keeps the price from falling further. When the price approaches a support level, traders expect the asset to become attractive enough to buy, which leads to an increase in demand and, as a result, a higher price.
Resistance level
On the contrary, a resistance level denotes a price level above which the price usually does not rise due to supply exceeding demand. This limits further price increases. Reaching this level is often seen by traders as a sell signal, expecting the price to fall due to the rise in supply.

What is Crypto Technical Analysis? How to Analyze Price Movements in the Cryptocurrency Market?
Read the articleCharacteristics of Cryptocurrency Support and Resistance Levels
Let’s take a look at what a support and line of resistance is on a chart:
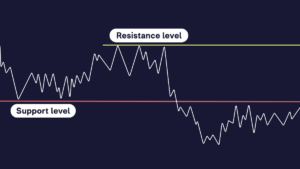
resistance and support lines
A support level is represented as a horizontal line below the current asset price, where buying interest is expected to be strong enough to stop the price from falling and turn it upwards.
A horizontal line above the current price represents a resistance level, signaling a point where selling volume can stop the price from rising and turn it down.
When price breaks through a support or resistance level, it often signals a change in trend or a strengthening of the current trend, especially if an increase in trading volume accompanies the breakout.
The Psychological Aspect of Support and Resistance Levels in Crypto Trading
The support level symbolizes the point at which the asset is perceived by traders as sufficiently undervalued, stimulating purchases and supporting the price from further decline. This psychological barrier signals buyers to enter the market actively, expecting the asset’s value to rise.
Similarly, a resistance level is perceived as the point where the asset is overvalued, leading to increased selling and limiting further price appreciation. This psychological boundary causes sellers to dominate buyers, waiting for a correction or trend reversal. Understanding these psychological aspects allows traders to anticipate possible changes in price behavior, strategically planning their actions depending on the general mood in the market and the expected price movements after the breakdown of these levels. Traders use resistance and support zone not only as indicators to identify psychological barriers in the market but also to identify broad areas where potential changes in price behavior are possible. This approach allows for a more flexible approach to trade planning.

How to Find Support and Resistance Levels in Crypto?
Resistance and support levels can be determined automatically using specialized indicators or manually by drawing horizontal (or sometimes sloping, in the case of trend lines) lines on the price chart. Crypto support and resistance indicator simplify determining these levels by analyzing historical data and highlighting the areas where the price has often stopped or reversed.
Visual analysis of charts
Crypto resistance and support levels can be found visually by using horizontal lines to mark historical price points where the price of an asset has shown significant stops or bounces. These repeating patterns form the basis for identifying support (below the current price) and resistance (above the current price) levels by drawing horizontal lines at these price points.
It is worth adding that the cryptocurrency market capitalization provides valuable insight into the scale and importance of a particular cryptocurrency in the market, which can influence the identification of crypto support and resistance levels.
Use of mathematical tools
Support and resistance levels can be determined using mathematical tools such as moving averages and Fibonacci retracement line, which offer dynamic levels based on mathematical calculations. For example, the 200-day moving average can act as a support level in an upward trend.
Psychological levels
Also, significant are psychological levels created by round numbers (e.g., 10, 50, 100) and significant historical highs (ATH) and lows (ATL). Traders often consider these numbers key barriers when placing buy or sell orders at them.
How To Draw Support And Resistance Lines?
Choosing crypto candlestick charts of cryptocurrencies is essential to correctly displaying levels of resistance and support on cryptocurrency charts. They give a complete picture of price movements. The primary step is to identify critical historical points where the asset’s price has repeatedly changed its direction or demonstrated significant rebounds, and it is desirable to find at least three such points for reliability. Using the drawing tools on the trading platform, draw horizontal lines connecting these points to visually expose support and resistance charts.
Remember the importance of trading volume, which can confirm the strength of each level, as changes in volume often signal the reliability of support or resistance. Remember that support and resistance levels are dynamic and can change over time, requiring regular reassessment. To increase the accuracy of your analysis, additional tools such as Fibonacci levels, moving averages, and psychological levels should also be applied, thus improving your support and resistance trading strategy and increasing the probability of success in the cryptocurrency market.
Benefits of Using Support & Resistance Levels in Crypto Trading
Trading on support and resistance levels provides traders with significant advantages, improving their strategic position in the market. A key advantage is identifying potential entry and exit points for trades. This provides effective risk management, avoiding emotional decisions through clearly defined stop loss orders and profit-taking levels. Support and resistance levels also reflect psychological barriers, providing valuable information about market sentiment and potential reversals or trend continuation.
Trading from support and resistance zones allows for a wide range of common strategies, from quick scalping to long-term investments. This emphasizes the flexibility of trading approaches and the ability to adapt to various market conditions. Together, these aspects make trading from support and resistance levels a powerful tool for improving trading results through a deep understanding of market dynamics and optimized risk management.
Risks of Using Support & Resistance Levels
Firstly, you should beware of false breakdowns of levels, for example, when the Bitcoin’s price or other cryptocurrency temporarily crosses these thresholds, which can mislead you about the natural direction of the market. This can cause unwanted trade entries or incorrectly set Stop-Loss orders.
In addition, crypto trading support and resistance levels are not immutable, and market conditions can suddenly change due to external events, including news and economic indicators, leading to unexpected breakdowns of these levels.
Accurately identifying Bitcoin support and resistance levels requires experience and detailed analysis. Risks increase if traders rely solely on these levels, ignoring other indicators and market context. Therefore, successful trading requires a comprehensive approach that includes using various analytical tools and constantly updating strategies to adapt to market dynamics.

What Is the Doji Candle Pattern and How to Use It in Crypto Trading?
Read the articleHow to Trade Using Support and Resistance in Crypto?
Here are a few recommendations from traders on how to trade from support and resistance levels:
- Identify levels: Find cryptocurrency support and resistance levels through historical analysis. Confirm entry signals by using candlestick patterns and analyzing changes in trading volume as you approach these levels.
- Stop-Loss orders and target levels: Place Stop-Loss orders outside key levels to minimize losses from market noise. Set realistic profit-taking targets based on the following support and resistance levels.
- Risk Management: Limit the risk per trade to 1-2% of your trading capital. This will help protect your portfolio from significant losses.
- Combination with other tools: Use additional analytical tools and indicators to clarify signals and better understand the market context, increasing the probability of your trades’ success. In addition to support and resistance levels, patterns of technical analysis are vital in determining future market movements.
Conclusion
Support and resistance indicators are central to traders’ strategies, determining the outcome of trades and influencing their financial results. Mastering and recognizing these key levels becomes a critical aspect of successful trading. These indicators offer traders temporary opportunities to lock in profits and optimize entry or exit, but their dynamic nature requires adaptation to ever-changing market conditions. While knowledge and practice are essential, remember the importance of the DYOR principle — doing your research — which is the foundation for making informed trading decisions and adapting to the dynamically changing cryptocurrency market.
FAQ
A resistance level in crypto is a price point where selling pressure is significant enough to prevent the price from rising further.
A support level is a price point where buying pressure is strong enough to prevent the price from falling further.
The difference between a support level and a resistance level is directional; support levels are where prices stop falling, while resistance levels are where prices stop rising.
The accuracy of signals provided by resistance and support levels varies and is not guaranteed, as market dynamics and sentiment influence them.
Trading strategies using SR levels include breakout trading, bounce trading, and using these levels for stop-loss or take-profit.
Tools to determine support and resistance include technical analysis software, chart pattern recognition, moving averages, and Fibonacci retracement levels.