What Is the Doji Candle Pattern and How to Use It in Crypto Trading?
Technical analysis plays a significant role in the working arsenal of every modern trader. One of the critical tools in this process is cryptocurrency charts, which provide insight into market movements. These charts display price changes over time and tend to form recognizable “patterns” that can give an edge when making trading decisions.

What is Crypto Technical Analysis? How to Analyze Price Movements in the Cryptocurrency Market?
Read the articleOne such pattern is the Doji, which means “same” in Japanese. As you can guess from the name, the candlestick indicates that a trade’s opening and closing prices are nearly or entirely the same. In this article, we will look at what a Doji candlestick is, how it works, how it is formed, and its primary functions.
What is a Doji Candlestick Pattern?
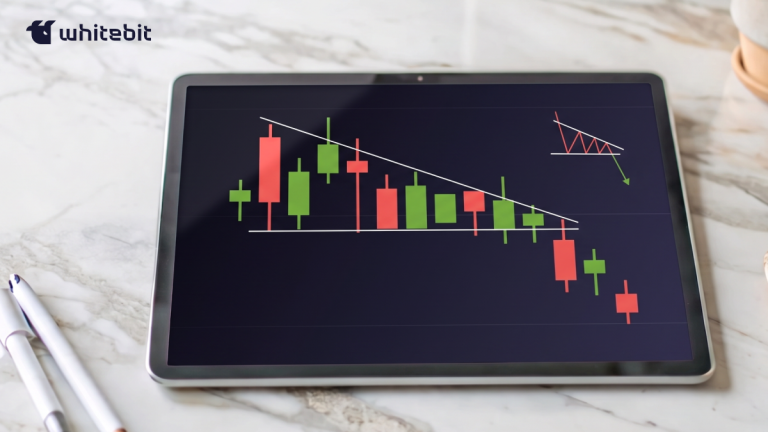
Doji candle pattern is a particular chart type, showing no clear leader among the market buyers (Bulls) and sellers (Bears). It doesn’t happen that often, but bullish and bearish sentiments sometimes meet.
The Doji candle appears as a thin line with long Shadows at the top and bottom. This means that prices at the beginning and end of the trading period were almost the same, but prices could vary significantly throughout the day. There are several types of Doji, each of which can indicate different sentiments in the market.
The Doji is not necessary on its own but in combination with other signals on the chart. This can lead to a trend reversal, pause, or continuation. The manifestation of a pattern may be associated with certain price levels. Sometimes, Doji can also indicate a lack of active trading in the market. Thus, traders need to understand what signal they are receiving: whether a trend reversal, pause, or continuation is possible.

How Does Doji Candlestick Work?
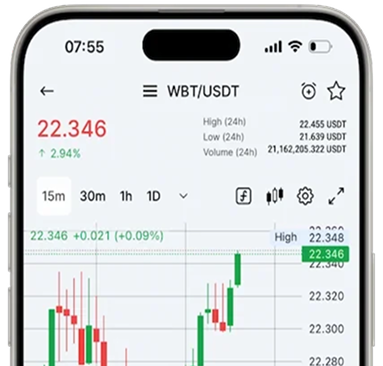
A Doji candle appears on a chart when an asset’s opening and closing prices are almost identical. This creates a candle with very little or nobody. The candle’s body is the difference between the opening and closing prices. There are shadows above and below the body; they show the maximum and minimum prices for the selected trading period. The color of the Doji candle (green or red) is usually insignificant since the price difference is slight.
A Doji candle may have long shadows on either side, indicating that prices have fluctuated dramatically throughout the day. Candlesticks such as the Long-Legged Doji or the Gravestone Doji can give different signals about the market. To understand a signal, it is essential to look not only at the candle itself but also at the candles before it, as well as at the general trend of the market.
How to Use Doji Candlestick in Cryptocurrency Trading?
Using a Doji candle in cryptocurrency trading requires careful analysis and understanding of the market context. When a Doji appears on the chart, it means that neither buyers nor sellers have been able to take the initiative, and the market is in a state of uncertainty.
When analyzing Doji patterns, they should be considered with other market indicators. For example, if a Doji occurs after a long uptrend, it may herald a trend reversal. However, to confirm this assumption, traders should consider other indicators, such as trading volume or moving averages. You can also use a stochastic oscillator to try to predict how the market will behave. It is important to remember that Doji candles are not a signal for immediate action but rather an invitation to deeper analysis and caution.
When analyzing a candle, pay attention to it and other signals on the chart. For example, if the Doji appears after a prolonged price rise, it may indicate a possible downward trend reversal. But before you decide, check other indicators, such as trading volume (how many assets are bought and sold) or moving averages (average price over a certain period). You can also use a stochastic oscillator, which helps predict price movements.
How to Identify a Doji Candlestick Pattern?
The definition involves recognizing several key characteristics on a price chart:
- Candlestick Body: The most noticeable sign of a Doji is its small or absent body. This occurs when an asset’s opening and closing prices are almost equal or the same during a specific period. Thus, a thin horizontal line appears on the graph.
- Wicks: Dojis often have visible wicks on the top and bottom of the candle body. These wicks indicate the maximum and minimum price for the trading period. The length of the wicks can vary, and their presence suggests that there were price fluctuations during the period, but the market eventually returned to the original open/close point.
- Context: Dojis typically becomes most significant after a significant uptrend or downtrend. For example, a Doji following a long series of upward candles can signal a potential weakening of the bullish trend. Convert crypto accompanied by the appearance of Doji candlestick patterns signals a possible turning point in the market, which requires traders to pay special attention to trend changes.
Furthermore, knowing what differenttypes of Doji candles look like in trading for a correct determination is essential.
Types of Doji Candles
Doji candles can take many forms, each providing unique insights into market behavior. Here are the main types of Doji candles and their characteristics:
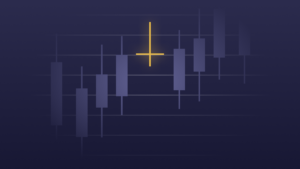
Neutral or Classic Doji:
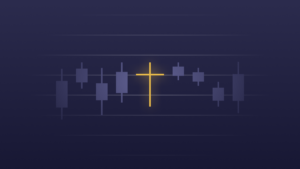
This type is the classic Doji with a cross shape, where the opening and closing prices are almost identical and are located approximately in the middle of the trading range. The candle wicks are evenly spaced up and down, indicating balance and uncertainty among market participants.
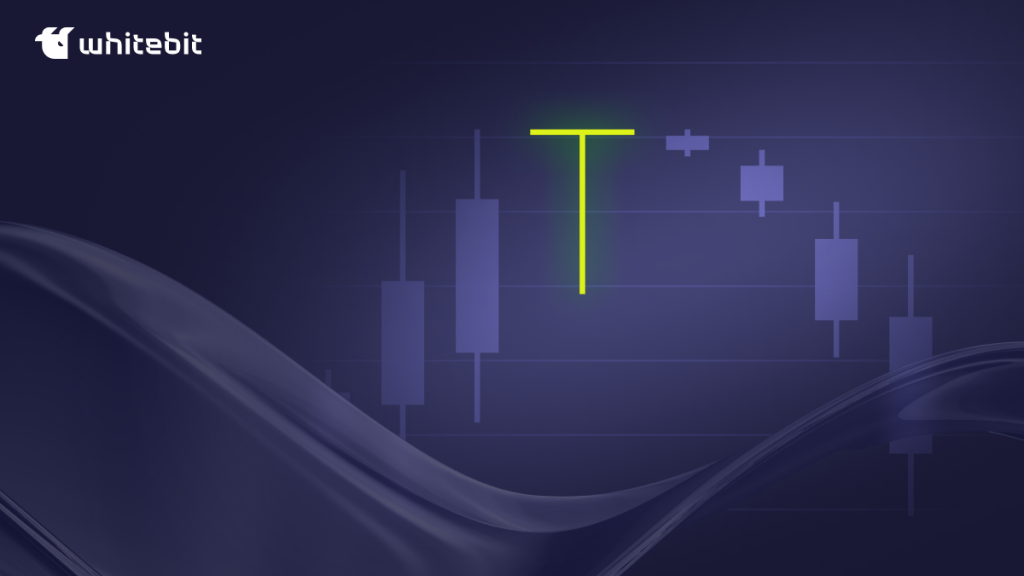
Gravestone Doji:
Opening and closing prices are at the lower limit of the range. The long upper wick shows that the bulls tried to increase the price, but the bears took over. This pattern is often considered a bearish signal.
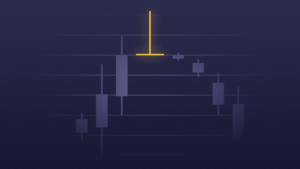
Dragonfly Doji:
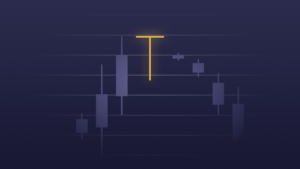
This Doji resembles a hammer. In this case, the opening and closing prices coincide at the top of the trading range, and the long lower wick indicates that sellers pushed the market down, but buyers could return it to the starting point. The candle is often considered a bullish signal, especially in a downtrend.
Long-legged Doji:
Long upper and lower shadows characterize this type, indicating significant price fluctuations during the trading period. However, the market closes at almost the same level it opened, indicating uncertainty among traders regarding its direction.
The 4 Price Doji:
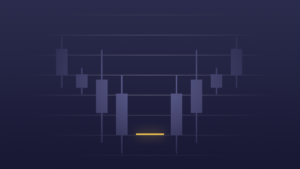
It’s a rare type of Doji that has a striped appearance. It looks like a single bar. This means the opening, closing, low, and high prices are identical. This indicates a complete lack of market movement and may indicate extreme uncertainty or low trading activity.
How to Trade with a Doji Candlestick Pattern?
Learning to trade using this pattern means mastering the art of interpreting market indecision and potential reversals. Crypto futures, like Spot, make it possible to use Doji in trading. Let’s look at how these patterns can be implemented into trading strategies.
Double Doji Strategy: A trading strategy based on finding two consecutive Dojis on a chart. The presence of two Dojis in a row increases the signal of uncertainty. It can foreshadow a significant price movement soon, mainly if it occurs in the context of a clear trend.
When it comes to using the Doji candlestick pattern in cryptocurrency trading strategies, it is essential to take different approaches to improve the accuracy and efficiency of your trades:
- Confirmation of support and resistance levels:
In this approach, the Doji candlestick is used to identify moments when the market tests key support or resistance levels. If a Doji forms at a support or resistance level, it may indicate the potential exhaustion of the current trend and the possibility of a reversal. Traders can use these moments to enter or exit positions, depending on whether the level holds or is broken.
- Reversal Patterns:
As we’ve already discussed, the Doji is often considered a signal of a potential reversal, especially when it appears after a long trend. After the Doji appears, traders look for confirmation signals in the following candles or indicators to confirm the trend change. It is vital to consider trading volume: an increase in volume when a Doji reversal appears can serve as additional confirmation of a change in trend.
- Continuation of the Trend:
Occasionally, a Doji may not indicate a reversal but a pause in the current trend. This is especially true if it appears in the middle of a consolidation. In such cases, the Doji can serve as a signal to confirm the continuation of the current trend after a short pause. Traders may look for additional signs, such as a consolidation breakout in the same direction, to confirm trend continuation.
- Placement of a Stop-Loss order:
When using Doji, setting Stop-Loss orders to manage risk is essential. They are usually placed outside the Doji wick range to avoid accidental activation due to market noise. The position can be adjusted depending on the overall market context and your trading goals.
Each approach requires an understanding of market dynamics and experience interpreting candlestick patterns. Additionally, it is essential always to consider the overall market context and use Doji with other indicators and analytical tools.
The WhiteBIT cryptocurrency exchange makes it possible to try trading Doji on a demo account without risking your money.
The Risks of Using Doji Candlestick
Despite their profound understanding, using Doji candlesticks in trading is associated with certain risks. Analyzing the cryptocurrency exchange rates, you can notice that the appearance of Doji candlestick patterns on the chart indicates market indecision and a possible change in the current trend. Such uncertainty may lead to premature or erroneous trading decisions.
Dojis often require confirmation from subsequent candles or additional technical indicators, which can delay the decision. Over-reliance on Doji patterns without considering the broader market context or other technical factors can misinterpret market sentiment. Therefore, traders should exercise caution and complement Doji candlestick analysis with a comprehensive trading strategy and sound risk management techniques.
Closing Thoughts
Doji candles alone are not a guarantee of accurately predicting market movements, but they can be a valuable tool for complex analysis. The use of Doji chart pattern helps identify potential trend changes and encourages traders to analyze the market situation more deeply before making trade decisions. Using Doji effectively requires practice and careful study of charts, especially in volatile and liquid markets. This helps you better understand how these patterns interact with broader market trends. Additionally, using Doji with other technical indicators and continually educating yourself to strengthen your trading skills and understanding of the market is important.
Start trading crypto
FAQ
The Doji candle itself is not bullish or bearish. It signals an indecisive market where the opening and closing prices are very close. Whether a candle is bullish or bearish depends on the market context and the position of the candle in the patterns.
Doji candlestick patterns indicate market indecision and their reliability increases when used with other indicators and in a specific market context. It does not provide complete confidence in the market's direction.
A Doji chart indicates market indecision when an asset's opening and closing prices are close, indicating a balance between bulls and bears.
After the appearance of the Doji candle, either a trend reversal or its continuation can occur. This depends on the context of the market trend and other indicators. If the Doji appears at the end of an uptrend, it could signal a potential bearish reversal. It could indicate a possible bullish reversal if it appears at the end of a downtrend.
Reading a Doji candle involves determining whether the opening and closing prices are equal, resulting in a small or missing candle body. It is also essential to pay attention to the length of the wicks, which can indicate price fluctuations.
Several basic types of Doji candlesticks include the classic Doji, the long-legged Doji, the dragonfly Doji, the gravestone Doji, and the four-price Doji.
Read also:
- A Beginner’s Guide to Day Trading Crypto
- What Is Crypto Scalping, and How Does It Work?
- Patterns of Technical Analysis
- Price Charts in Technical Analysis of Cryptocurrencies
- What is Crypto Technical Analysis? How to Analyze Price Movements in the Cryptocurrency Market?
- What is the Wyckoff Method and How to Apply It in Crypto Trading?