How To Read Crypto Candlestick Charts?
Content
Mastering the trading terminal and interpreting candlestick charts are key skills for any crypto trader. Candlestick charts provide valuable indications of market patterns, empowering traders to make well-informed choices. In this article, we’ll help you improve your proficiency in using trading terminals like WhiteBIT to their fullest potential and learn how to read candles.
What Are Candlesticks, and Why Are They Important to Learn?
Candlesticks are foundational elements in crypto charts, visually representing an asset’s price movements over set periods. Each candlestick encapsulates the opening, closing, high, and low prices, offering a snapshot of market activity. As traders string these candlesticks together, they weave a narrative of historical price fluctuations, serving as a roadmap for future trends.
- Visual Representation:Reading candles offer a graphical display of price movements, making complex data easily digestible.
- Historical Data: They provide a historical record of crypto price changes, helping predict future movements.
- Market Trends: Analyzing candlestick patterns helps traders identify prevailing market trends and potential reversals.
What are Candlesticks Charts?
Candlestick charts originated in Japan in the 18th century and offer detailed data on asset trading. They display opening, closing, and high, and low prices, providing insights into market sentiment and volatility. Candlestick charts remain a popular tool for those learning how to read crypto candlesticks and analyzing price movements in various markets, including cryptocurrency. They offer comprehensive data to interpret market trends and predict future price movements based on historical and current data.
How To Read Candlesticks In Crypto Trading?
Understanding candlesticks is pivotal in crypto trading, and it hinges on comprehending the structure and components of the candlestick chart.
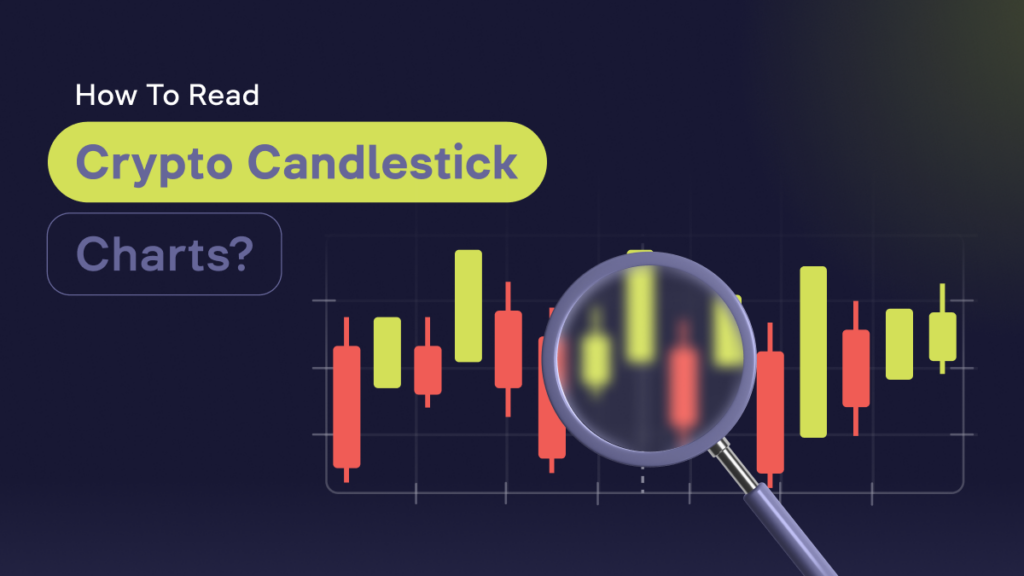
Each candlestick is composed of a body and wicks:
- The body represents the opening and closing prices of a specific trading period. When the body is green, it signifies that the closing price was higher than the opening price, indicating a bullish or positive market sentiment. Conversely, a red body indicates that the asset closed lower than its opening price, signaling a bearish or negative Sentiment.
- The wicks (shadows) extend from the body and represent the highest and lowest prices reached during the trading period. The upper wick extends to the highest price point, while the lower wick reaches down to the lowest price point. The length of the wicks can provide insights into the market’s volatility. Longer wicks suggest a larger price range and, therefore, increased volatility.
Traders analyze the combination of body colors and wick lengths to identify patterns suggesting future price movements. These patterns, formed over specific periods, can indicate trends, reversals, or market indecision. Understanding how to analyse candlestick charts serves as a valuable tool for traders to make informed decisions in the fast-paced crypto market.
What do Crypto Candlesticks Charts Tell Us?
Crypto candlestick charts offer valuable insights into market sentiment and volatility. Traders use these charts for technical analysis, identifying patterns that signal bullish or bearish trends, and guiding informed trading decisions.
Additionally, candlestick charts can provide insights into:
- Volume Analysis: By correlating the candlestick patterns with trading volume, traders can gauge the strength or weakness of a price trend.
- Support and Resistance Levels: Candlesticks help identify areas where the asset finds a support floor or resistance ceiling, which is crucial for predicting price movements.
- Price Breakouts: Certain patterns can indicate imminent price breakouts, allowing traders to enter or exit positions advantageously.
- Market Reversals: Specific candlestick formations can signal a change in trend direction, helping traders to adjust their strategies accordingly.
- Entry and Exit Points: Analyzing candlesticks aids traders in determining optimal points to enter or exit trades, maximizing profitability and minimizing risk.
These indicators, derived from the meticulous analysis of candlestick patterns, play a pivotal role in shaping trading strategies, offering traders a nuanced understanding of market dynamics.
Popular Candlestick Patterns and What They Indicate
Bullish Candlestick Patterns
Bullish candlestick patterns indicate a potential rise in asset price, pointing to a shift towards a positive market sentiment. As traders learn to read candlestick charts, they typically use these patterns, which appear at the end of a downtrend, to identify suitable moments to initiate long positions.
Here are the most popular bullish patterns:
Appearance: Small body with a long lower wick, appearing during a downtrend.
Indication: Signals a potential reversal as buyers start stepping in.
- Inverted Hammer
Appearance: Small body with a long upper wick, found at the end of a downtrend.
Indication: Suggests a potential bullish reversal, indicating the return of buying interest.
- Three White Soldiers
Appearance: Three consecutive long green candles, each closing higher than the previous one, following a downtrend.
Indication: Indicates a strong reversal and the beginning of a new uptrend.
- Morning Star
Appearance: A three-candle pattern with a long red candle, followed by a small-bodied candle, and then a long green candle.
Indication: Signals the end of a downtrend and the onset of an uptrend.
- Bullish Engulfing:
Appearance: A small red candle followed by a larger green candle that completely engulfs the red candle, occurring during a downtrend.
Indication: This represents a sudden shift from selling to buying pressure, indicating a potential upward price movement.
Bearish Candlestick Patterns
Bearish candlestick patterns signal a potential decline in asset price, indicating an emerging negative market sentiment. As traders seek an easy way to read candlestick charts, they’ll notice these patterns often appear at the end of an uptrend and are characterized by candlesticks where the closing price is lower than the opening price, resulting in a red or black body.
The most popular bearish patterns:
- Hanging Man
Appearance: Small upper body with a long lower wick, appearing after an uptrend.
Indication: Suggests that selling interest increases, potentially signaling a top or a strong resistance level.
- Shooting Star
Appearance: Small lower body with a long upper wick, occurring after an uptrend.
Indication: Indicates potential price top and upcoming price decline as sellers start to outweigh buyers.
- Three Black Crows
Appearance: Three consecutive long red candles with short or non-existent wicks, each opening within the previous candle’s body.
Indication: Signals a strong reversal, indicating that bears have taken control of the bulls.
- Bearish Engulfing
Appearance: A small green candle followed by a larger red candle that completely engulfs the green candle, occurring during an uptrend.
Indication: Indicates a shift from buying to selling pressure, signaling a potential downward price movement.
- Dark Cloud Cover
Appearance: A long green candle followed by a red candle that opens above the green candle’s high but closes well into the green candle’s body.
Indication: Suggests a potential reversal from bullish to bearish sentiment, indicating increased selling pressure.
- Evening Star
Appearance: A long green candle, followed by a small-bodied candle that gaps above the first, and then a red candle that closes well into the first candle’s body.
Indication: Indicates a top and potential reversal from an uptrend to a downtrend, signaling increased bearish sentiment.
Each of these bearish patterns can signal traders to consider closing long positions or opening short positions, anticipating a decrease in asset price.
Neutral Candlesticks
Neutral candlestick patterns indicate uncertainty and indecision in the market, where neither the buyers nor the sellers have significant control. These patterns often suggest a potential change or continuation in trend, prompting traders to watch for subsequent patterns to confirm the market’s direction.
There are the following neutral patterns:
- Doji
Appearance: A candlestick with a very small body and long upper and lower wicks, indicating that the opening and closing prices are virtually equal.
Indication: Represents indecision in the market, where neither buyers nor sellers have control, often leading to a change in trend.
- Spinning Top
Appearance: A small body with long upper and lower wicks occurring during either an uptrend or downtrend.
Indication: Indicates uncertainty and potential reversal or continuation of the trend, as neither buyers nor sellers could gain the upper hand.
These neutral patterns are crucial for traders as they often precede significant price movements, offering an opportunity to prepare for upcoming volatility.
Reversal and Continuation Patterns
Candlestick patterns indicate trend changes or continuations. Reversal patterns signal potential tops and bottoms, while continuation patterns confirm the ongoing trend. Traders use these patterns to time their entries and exits effectively.
Here are the examples of these patterns:
- Double Top and Double Bottom
Appearance: Double Top forms after a strong uptrend, characterized by two peaks at nearly the same level. Double Bottom occurs after a strong downtrend, marked by two troughs at nearly the same level.
Indication: Double Top signals a bearish reversal, while Double Bottom indicates a bullish reversal, marking potential trend changes.
- Head and Shoulders
Appearance: Features three peaks, with the middle peak (head) being the highest and the two other peaks (shoulders) being lower and roughly equal.
Indication: Indicates a reversal; a regular pattern signals a bearish reversal after an uptrend, while an inverted pattern signals a bullish reversal after a downtrend.
These patterns are instrumental for traders to anticipate potential changes or continuations in trends, allowing for strategic planning of trades to maximize profits and minimize risks.
Pros and Cons of Using Candlestick Charts
Pros:
- Insightful: Offer valuable insights into market sentiment and investor behavior.
- Identify Trends: Help in identifying potential trends and optimal entry/exit points.
- User-Friendly: Easy to interpret, suitable for traders of all skill levels.
Cons:
- Historical Data: Based on past price data, may not always predict future movements accurately.
- Subjective Interpretation: Different traders might interpret the same pattern in varied ways.
- Not Standalone: This should be combined with other technical and fundamental analysis tools for a comprehensive market view.
Candlestick patterns, essential in understanding how to read candlestick graph in crypto, are a popular tool among crypto traders, providing a visual and intuitive means to analyze price movements. However, they should be used cautiously and complemented with other forms of analysis to enhance trading accuracy and efficiency.
Practical Tips for Reading Crypto Candlesticks
- Combining Candlestick Patterns with Other Technical Analysis Tools
Understanding how to read candlestick charts in cryptocurrency is essential, but using multiple technical analysis tools along with candlestick patterns can provide a more complete market outlook, leading to better trading decisions.
- Risk Management and Stop-Loss Orders
As traders learn to read candlestick charts, they’ll appreciate the importance of stop-loss orders. These orders help traders protect their capital by predetermining the level at which they will cut losses. It allows traders to have a clear exit strategy, avoid substantial losses, and stick to their risk tolerance during rapid market downturns.
- Emotional Discipline in Trading
Emotional discipline is critical in crypto trading. As traders seek the best way to read candlestick charts, they must also manage their emotions to avoid impulsive decisions and significant losses.
As a result, candlestick charts help make informed decisions, but combining analysis with other tools, practicing risk management, and maintaining emotional discipline is vital.
FAQ
Traders use candlesticks, especially when they understand how to read Japanese candlestick charts, to decide whether to buy or sell an asset. They look for specific candlestick patterns that indicate potential price movements, trends, or reversals to make informed, quick decisions on buying or selling.
It signifies a bearish movement, meaning sellers dominated the market, leading to a decrease in price.
A candlestick consists of individual “candles” showing the opening, closing, high, and low prices, offering insights into market trends, sentiment, and potential future price movements.
A green candle indicates a bullish movement, where buyers dominate the market, leading to an increase in price.
Long wicks on a candlestick show a high price difference in a period. A long upper wick means selling pressure, while a long lower wick shows buying pressure. They signal market volatility and possible reversals.
The most common trading mistakes are relying only on candlestick patterns, misinterpreting them, ignoring the market context, emotional trading, and lack of risk management.
- What Is a Crypto Liquidity Provider And How Do They Work?
- What is cryptocurrency mining?
- What is Spot Trading in Crypto, And How Does It Work?
- How to Create a Cryptocurrency?
- What is a cryptocurrency, and how does it work?
- What Is Launchpad In Crypto? Launching a Crypto Project to the Moon in 3, 2, 1…

