What Is a Hammer Candlestick Pattern?

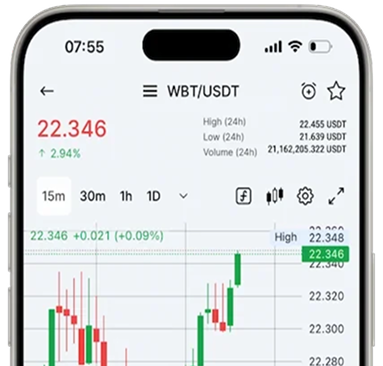
To succeed in trading, paying attention to technical analysis is essential. Cryptocurrency charts help traders find patterns and form a trading strategy. In addition, they help to identify both the asset’s prospects and weaknesses. Understanding trading patterns on charts is a crucial skill for traders to identify better when to make trades. These patterns act as market navigators, providing valuable information about potential trend reversals or continuation.
One such pattern is the hammer. In this article, we will tell you about the key features of the “hammer,” show what it looks like, and analyze its meaning in the market.
What Are Hammer Candlestick Patterns?
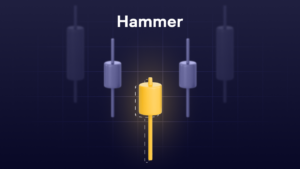
The “hammer” candlestick pattern is a candlestick that often serves as a signal of a possible reversal of the current downtrend. Hammer chart pattern is formed within one candle and looks like the letter “T.” It can be seen on charts of various time intervals. “Hammer” is often combined with other trading strategies and analysis tools. This helps to identify the signal of an upcoming reversal.

What Does the Hammer Trading Pattern Look Like?
Traders widely use the “hammer” pattern for its ease of detection — it is a single candle with a small body and a long shadow. The candle’s color depends on the stock exchange chart and can be either green (or white) or red (or black), depending on the direction of the price movement.
The most prominent element of the pattern is the long lower shadow, which shows the strength of buyers despite the decline in price at the beginning of the trading period. The upper shadow is usually short or absent, which indicates weak pressure of sellers at the end of the trading period. The visual similarity with the hammer explains the origin of the pattern name. The appearance of a “hammer” after a long decline may indicate the exhaustion of sellers’ strength and the beginning of an uptrend.
Types of Hammer Candlesticks
Bullish hammer pattern:
Indicates a potential reversal of a downtrend into an uptrend. There are two types of bullish hammer candlestick:
- Straight “hammer“ candlestick:
This type of candlestick is often found at the end of a downtrend, foreshadowing a possible transition to an uptrend. It has a small body at the top and a long lower shadow. It shows a significant downward price deviation during the hammer candle trading session, followed by a return to the initial cost or higher. The body color can be green or red, but green is a more powerful hammer reversal pattern indicator.
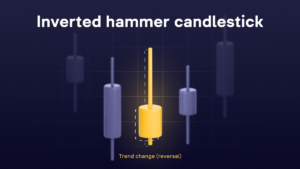
- Inverted hammer candlestick chart:
An upside down “hammer”. This pattern occurs when the opening price is below the closing price. In this case, the candle’s long wick is above its body, indicating intense buying pressure to push the price up. However, despite their efforts, the price was pushed down before the candle closed. Although this pattern is less evident than the standard “hammer” pattern, it still indicates significant buying pressure.
Bearish hammer:
Signals a potential reversal of an uptrend into a downtrend. There are two types of bearish hammer candlestick:
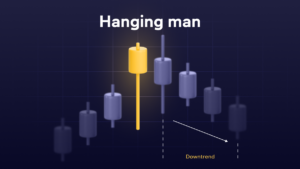
- «Hanging man» candlestick:
Red hammer candlestick, is formed when the opening price is higher than the closing price. The long lower wick of the candlestick indicates the presence of selling pressure in the market. The sellers still control the market since the closing price is lower than the opening price. Therefore, this candlestick is considered bearish.
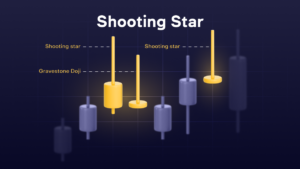
- «Shooting star» candlestick:
It resembles an inverted “hammer” but signals a bearish reversal. The pattern occurs at the top of an uptrend. It is characterized by a small body in the lower part of the candlestick and a long upper shadow, which illustrates the market’s inability to support further growth, reflecting the price pullback after its short-term rise during the trading session.
How the Hammer Candlestick Works?
The hammer candle plays a crucial role in market analysis, reflecting changes in the balance of power between buyers and sellers. By understanding the mechanism of the hammer pattern and knowing how does stop loss and take profit work, traders can improve their trading skills. A candlestick is formed when the price of an asset first drops significantly below the opening level, but then recovers to close near or above that level. This movement creates a short body and a long lower shadow of the candlestick. This long lower shadow is evidence of intense selling pressure during the period. However, the triumphant return of price to the original level or even above emphasizes the confidence and strength of buyers, which may portend a potential reversal of the downtrend.

How to Use Hammer Candlestick Patterns in Crypto Trading?
The crypto volatility makes the appearance of hammer candlesticks more frequent. It requires careful confirmation of signals through additional indicators such as trading volumes, moving averages, or Fibonacci retracement levels.
Traders’ tips for using hammer candlesticks:
- Combine the hammer with other indicators, such as RSI or MACD, for more accurate confirmation of downtrend;
- Analyze context: “Hammer” is most significant after a long downtrend or at support levels;
- Be alert to false signals, especially when crypto rates are volatile;
- Apply risk management strategies by placing Stop-Loss orders to minimize potential losses.
How to Identify a Hammer Candlestick?
- Studying the candlestick shape
Candle Body: The Hammer is characterized by a small body at the top of the trading range, indicating a slight difference between the opening and closing prices. The color of the body can vary, but a green hammer candle indicates a stronger bullish signal. However, there is also a bearish signal, as mentioned above.
Lower shadow: Characterized by a length twice the size of the body, which demonstrates a pullback in price after a significant drop.
Upper shadow: The absence or minimal size of the upper shadow emphasizes the absence of selling pressure at the end of the period.
- Analyzing the context of the occurrence
The green hammer candlestick should be formed after a significant downtrend. Its appearance indicates a possible reversing, indicating the tiredness of sellers and the increasing strength of buyers.
- Confirmation with indicators
Moving Averages: A hammer candlestick appearing below crucial moving averages may indicate the beginning of a trend reversal.
Volume: An increase in trading volume during a hammer formation confirms interest in the asset and support for a reversal.
Momentum Indicators: RSI or MACD can help identify oversold conditions, reinforcing a potential reversal signal.
- Considering the market context
It is important to consider general market trends, news, and events that may influence price dynamics, further confirming or denying the potential of a hammer candlestick to reverse a trend.
Common mistakes include:
- Ignoring the overall trend: Pay attention to the preceding downtrend to ensure the hammer pattern is understood.
- Lack of additional confirmation: Relying on only one pattern without confirmation by other indicators increases the risk of poor trading decisions.
- Ignoring Volume: Ignoring trading volume when a hammer pattern appears can lead to underestimating the strength of a potential reversal.
- Ignoring volatility: Failure to understand the impact of high volatility in crypto markets can lead to premature or erroneous trading decisions.
Hammer Trading Pattern: Pros and Cons
Pros
- Shows the price trend not only in cryptocurrency but also in other financial markets;
- Easy to recognize on the chart, making it accessible to traders of all levels.
- Can be used as a trend reversal or continuation indicator, depending on the market context. It can also be used on different timeframes, from short to long, making it a versatile tool for various trading strategies such as day trading crypto.
- It is effectively combined with other analytical tools such as moving averages, RSI, and MACD, providing a more profound and more comprehensive crypto technical analysis
Cons
- It is not a completely reliable pattern and can sometimes give false signals. Even after the hammer appears, the price may continue to decline. This increases the risk of wrong trading decisions and potential losses.
- Traders should base their decisions on something other than this indicator, as it may need to be more reliable. To increase the reliability of “hammer” signals, it is necessary to look for additional confirmation through other indicators or patterns, which may delay the moment of entry into the transaction and, consequently, reduce the potential profit.
Provided the correct analysis and use of the candlestick pattern “hammer,” many may decide to buy Bitcoin and start their journey of trading in the cryptocurrency market.
Hammer Candlestick Trading Strategies
The hammer pattern is often used as part of conservative trading strategies because it offers a strong signal of a potential trend reversal after a period of decline. Let’s take a closer look at how the hammer pattern fits into a conservative trading strategy:
Risk Management: A conservative strategy involves strict adherence to risk management rules. The “hammer” pattern allows for precise levels for placing Stop-Loss orders — usually slightly below the lower shadow of the “hammer,” which helps to limit potential losses if the expected market reversal does not occur.
Psychological aspect: Conservative traders often consider the psychological aspect of the market. The hammer pattern can serve as a solid signal to the market that selling may be exhausted, and a reversal is imminent, attracting the attention of other market participants and creating additional support for a trend reversal.
Interaction with support levels: A conservative hammer candlestick trading strategy places great importance on analyzing support and resistance levels. The appearance of a hammer pattern near crucial support levels can serve as additional confirmation of the strength of these levels and the upcoming upward bounce in price.

Hammer vs. Doji: The Main Differences
The “Hammer” and “Doji” differ in shape and their signals to traders. “Hammer” is characterized by a small body on top and a long lower shadow, indicating a potential trend reversal after a period of decline. It is considered a more concrete signal of a possible change in sentiment from selling to buying. Meanwhile, the doji candlestick pattern has almost identical opening and closing prices, forming a cross or linear shape and signaling indecision in the market without explicitly indicating the direction of future movement.
The main difference is that the Hammer heralds a possible upward reversal after a downtrend. At the same time, the doji can appear in any trend phase, indicating moments of indecision and a potential, but not guaranteed, trend reversal. These differences make the Hammer a more specific reversal indicator, while the doji requires additional context analysis and subsequent candles to confirm the trend.
The Bottom Line
A good trader needs to know how to read candlesticks in crypto. Despite the potential advantages of identifying a trend reversal, you need to consider the possibility of false signals. It would help if you did not immediately react to a signal of a possible reversal, as confirmation of a trend always requires using other indicators. Remember that there is no guaranteed success in trading, and every trade involves a certain level of risk. Nevertheless, with constant training, market analysis, and developing trading skills, you can increase your chances and successfully use the “hammer” candlestick pattern and other technical analysis tools.
FAQ
The standard "hammer" is a bullish signal. However, there is also a bearish type of "hammer" that we mentioned earlier. These patterns are known as "hanging man" and "shooting star".
A hammer candlestick is a bullish signal that often appears at the end of a downtrend and indicates a possible upward reversal.
To read a hammer candlestick, look for a candle with a small body at the top and a long lower wick at least twice the length of the body, with little or no upper wick.
"Hammer" resembles the letter "T." It has a small body and a long lower shadow, while the upper shadow is absent or very short.
The difference between the standard "hammer" and the "shooting star" lies in their direction and interpretation: the "hammer" represents a bullish signal, indicating a possible reversal of the uptrend. In contrast, the "shooting star" signals a potential downtrend reversal.