Bull Flag and Bear Flag Chart Patterns Explained

The growing interest in cryptocurrencies causes the need for advanced market analysis tools to help make more accurate decisions. Technical analysis is used for this purpose. It helps to evaluate certain trends in the crypto market. Patterns are one of the tools of technical analysis. These are certain figures on the chart from which you can make a forecast of market movement. Among the many technical analysis patterns at your disposal, two stand out prominently: bullish flag trading and bearish flag trading. In this article, we will discuss these popular patterns, called bullish and bearish flag patterns. We will figure out how they work and how to use them when trading on the stock and crypto exchange or investing in cryptocurrency.
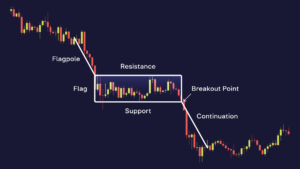
In technical analysis, a flag is one of the graphic patterns with a unique structure. It consists of two main elements:
- A sharp price movement called flagpole;
- A slow price movement occurring in the opposite direction or as part of a sideways movement, which is called a flag.
These two components are bounded by two trend lines: support and resistance. The flag pattern gets its name from its visual resemblance to a flag hanging from a flagpole.
Why Are Patterns Needed in Trading?
Patterns in cryptocurrency trading and financial markets, in general, play a vital role in analysis and decision-making. Essentially, these are repeating patterns in price data, trading volumes, and other indicators that can assist traders and investors in predicting price movements. Here are a few reasons why patterns matter in trading cryptocurrency and other assets:
- Identification of Possible Trends. Patterns can assist traders in identifying the current trend in the market. For instance, bullish and bearish flag patterns serve as indicators of potential trend continuation upward or downward, respectively. This enables traders to ascertain the likely direction of price movement and make trading decisions accordingly.
- Signal Acknowledgment. Patterns can be used to confirm other signals and indicators. For example, if a technical indicator shows a strong buy signal, and the chart shows bullish patterns, this can strengthen the trader’s confidence in making a purchase decision.
- Determining Entry and Exit Points. Patterns help determine the optimal entry and exit points for a trade. Traders may decide to open a sell position when they see a bear flag chart and prices are approaching the lower border of this pattern.
- Risk Management. Understanding patterns aids traders in managing risk more effectively. By analyzing pattern-derived data, you can identify price levels to save their capital from losses or to secure profits by placing Stop-Loss and Take-Profit orders accordingly.
- Temporal Forecasting. Some patterns can help predict when the market might change from sideways to trending or vice versa. This can be useful for investors who want to enter or exit a position at a specific time.
- Market Psychology. Patterns can reflect the psychology of market participants. For example, a long tail of a bearish pattern may signal a possible shift from pessimism to optimism among traders.
- Training and Sharing Experience. Studying patterns is an integral part of the learning process for many traders. They analyze past patterns to gain a more in-depth understanding of the market, make well-informed decisions, and develop new trading strategies. Furthermore, there are communities and resources where traders exchange experiences, learn how to read candles on cryptocurrency exchanges, and engage in discussions about patterns and strategies.
It is important to note that patterns are not completely reliable indicators and can give false signals. Therefore, they are best used with other analytical methods, risk management strategies, and possibly fundamental analysis to make more informed decisions.
Types of Flag Patterns
Flags are components of graphical analysis that help traders and analysts determine the potential direction of price movements. They can manifest themselves in both uptrends and downtrends, typically serving as indicators of a likely continuation of the prevailing trend. There are two primary types of flags: the bull flag and the bear flag.
What Is a Bull Flag?
The bull flag pattern, a rising flag, appears during an uptrend and indicates that the market may continue to increase. Key characteristics of a bull flag:
- Uptrend. There is a previous uptrend that indicates the price of the cryptocurrency is rising.
- Price Correction. After an uptrend, the price begins to correct downwards. This creates a sloping line that links the lows of price movements and forms support.
- Parallel Horizontal Line. A horizontal line is created parallel to the sloping line, which connects the maximum points of price movements and indicates resistance.
- Signal to Buy. When the price approaches the upper border of the flag, this can serve as a signal for the trader to open a Buy or Long position, waiting for a continuation of the trend growth.
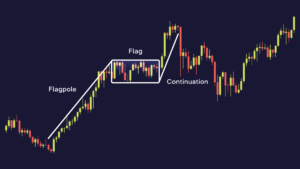
A bullish flag pattern might look like this:
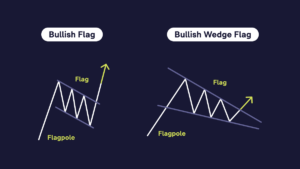
The chart clearly shows the key characteristics of the flag:
- Flagpole is a strong price increase, which usually occurs over a short period;
- Consolidation is a phase in which the price can move down or sideways, creating a figure similar to a rectangle (flag).
The flag can also take the shape of a wedge. A bullish wedge differs from a flag in its appearance on the chart. The flag looks more like a rectangle, and the wedge is triangular in shape.
What Is a Bear Flag?
Bear flag, a descending flag, appears during a downtrend and indicates that the market may continue to move down. Main characteristics of the bear flag:
- Downtrend. There is a previous downtrend that indicates a decline in the price of the cryptocurrency.
- Price Correction. After a downtrend, the price begins to correct upward. This creates a sloping line connecting the maximum price movement points (support).
- Parallel Horizontal Line. A horizontal line is created parallel to the sloping line, which connects the minimum points of price movements (resistance).
- Sell Signal. When prices approach the flag’s lower border, this can signal the trader to open a sell or short trade, expecting the downward trend to continue.
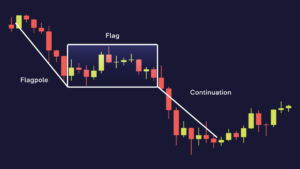
A bearish flag pattern might look like this:
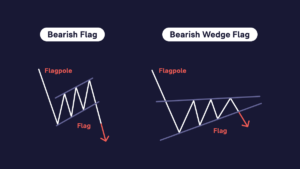
The bearish flag in trading looks like a mirror to the bullish one. There are key elements here, too:
- Flagpole — this time, we see a sharp reduction in price;
- Consolidation — a sideways or upward movement similar to the figure of the flag itself.
Trading Bull Flags and Bear Flags Patterns in Cryptocurrency
Flags can be a powerful tool for a trader or investor in the cryptocurrency market. Their application involves steps that we will cover below.
How to Trade Using Flag Patterns, and What Is a Breakout Strategy?
A breakout strategy is a popular approach in cryptocurrency trading that involves identifying potential price movements after a period of consolidation, often associated with flag patterns. Flags, as mentioned earlier, are technical chart patterns that can signal a continuation of an existing trend. Here’s how the breakout strategy with flag patterns works:
- Flag Identification. The first step is to detect the flag pattern on the cryptocurrency price movement chart. This pattern can be either ascending or descending — bullish and bearish, respectively. To detect a flag, a trader needs to analyze the charts and look for the specific characteristics of the flag. Example: a rapid impulse of rising or falling price forming a “flagpole” followed by an upward or downward (depending on the type of flag) price consolidation within support and resistance boundaries.
- Signal Confirmation. The flag signal acknowledgment may include the following:
- Trade Volume. Check whether there was an increase or decrease in trade volume during the formation of the flag. Typically, an increase in volume at the end of the flag can serve as an additional signal.
- Other Technical Indicators. Use other technical indicators, such as the Relative Strength Index (RSI) or Moving Average Convergence Divergence (MACD), to ensure that the current market conditions support the flag signal.
- Setting Entry and Exit Points. Once the flag pattern is identified and the signal is confirmed, the trader can decide when to enter and exit the position:
- Entry Point. Typically, the entry point into a position occurs near the border of the flag. For example, in a bullish flag, traders may consider opening a buy position when prices rise closer to the top of the flag. For a bearish flag, a sell entry point may be considered when prices approach the lower boundary of the flag.
- Exit Point. The exit point for a position can be determined based on desired profit levels and maximum losses. Traders can set Stop-Loss to protect them from large losses and Take-Profit at the desired profit-taking level. Often, Stop-Loss is placed on the opposite border of the flag, and Take-Profit is placed at the next support or resistance level, depending on the direction of the flag.
- Risk Management. To manage risks effectively, controlling your position size and avoiding risking too much capital in a single trade is crucial. Additionally, losses can be mitigated by implementing Stop-Loss orders, which automatically close a position when the asset reaches a predetermined price, limiting potential losses.
- Mental Resilience. The cryptocurrency market can be quite volatile, and cryptocurrency prices can change significantly within a day, so traders should be mentally tough. Emotions can lead to impulsive decisions, so it’s essential to adhere to your trading strategy and avoid panic when cryptocurrency rates change.
- Monitoring and Analysis. Once a position is entered, traders should consistently monitor and analyze the asset’s price movements to assess whether they align with their forecasts. Depending on the situation, adjustments to the position or closing may be necessary.
- Training and Practice. Proficiency in utilizing flag patterns requires practice and experience. Traders should continuously educate themselves, study historical data, and practice on demo accounts before applying this knowledge to real assets in spot and crypto futures trading.
- Discipline. Crypto trading demands discipline, as it’s essential for traders to adhere to their strategies and resist deviating from them due to emotions or random price fluctuations.
At the same time, you need to understand that patterns cannot ensure 100% success, and trading is always associated with risk. It is important to apply risk management strategies and follow your trading plan.
To better distinguish flags on cryptocurrency charts, let’s look at what they might look like in real life.
What Does a Bull Flag Look Like?
In this chart, we see a bull flag formation. After an uptrend, a consolidation phase begins, which creates a rectangle. This may indicate a further rise in price and may serve as a signal to open a position to buy cryptocurrency.
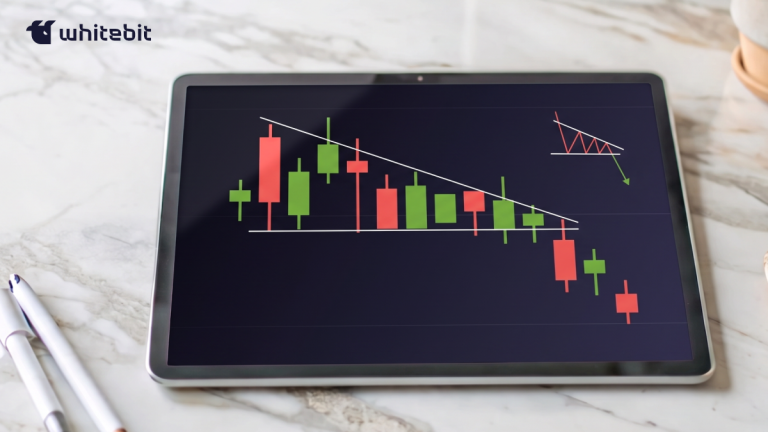
What Does a Bear Flag Look Like?
In this chart, we see a bearish flag formation. After a downtrend, prices begin to correct upward, creating a sloping line. A horizontal line connecting the minimum points of price movements indicates the potential for continued price declines.
Advantages and Disadvantages of Trading the Bull Flag Pattern and Bear Flag Pattern
Like any technical analysis pattern, flags have their advantages and disadvantages. For example, using a flag, you can successfully buy cryptocurrency, but you can also “catch” a false signal and incur losses, which is especially risky in crypto leverage trading. Let’s take a closer look at the advantages and disadvantages of each pattern.
Benefits of Bull Flags and Bear Flags:
- Trend Identification. Bullish flags in trading typically form during an uptrend, while bearish flags, conversely, occur during a downward trend. This enables traders to confirm the current market direction.
- Clarity and Simplicity. Flags are relatively easy to spot on charts, and their shape is usually well-defined. This makes them accessible even to beginners.
- Clear Entry and Exit Points. Flags offer clear entry and exit points for trades. The entry point for a bullish flag is typically closer to the upper boundary of the flag, while for a bearish flag, it’s closer to the bottom. To determine the exit point, you can replicate the height of the “flagpole,” place it above the breakout point (or below in the case of a bearish flag), and set the Take-Profit slightly below (above for a bearish flag) its highest point.
- Signal Confirmation. Both bullish and bearish flag patterns can serve to confirm other technical signals, enhancing the trader’s confidence.
Risks of Bull Flags and Bear Flags:
- False Signals. Not all patterns resembling a bullish or bearish flag are genuinely strong buy or sell signals. This can lead to false trades and the potential loss of capital.
- Limited Applicability. Flags are effective in both uptrends and downtrends, but they may not always be applicable in all market situations. For instance, their signaling strength may diminish in sideways markets.
Common Mistakes and How to Avoid Them
Trading using technical analysis can be quite challenging, so let’s take a look at common mistakes and strategies for avoiding them.
- Ignoring the Bigger Picture. One of the most significant mistakes is trading a flag pattern without considering the overall market context. Always try to look at the larger trend before deciding. Trading against the predominant trend can be risky.
Avoidance. Start by analyzing the broader market conditions and identify the trend in which the flag pattern is forming. Trade in the direction of the larger trend for a higher probability of success. - Overtrading. Some traders tend to see bear and bull flag patterns everywhere, leading to overtrading. They may enter positions prematurely or in low-quality setups.
Avoidance. Be selective in your trades. Not every flag pattern is worth trading. Wait for clear and strong flag patterns that have a well-defined structure and are in line with the prevailing trend. - Setting Incorrect Stop-Loss Levels. Placing Stop-Loss orders too close to the entry point can lead to premature exits due to market noise, while setting them too far away can result in significant losses if the trade goes against you.
Avoidance. Use technical analysis tools like support and resistance levels, moving averages, or trend lines to set appropriate Stop-Loss levels. The placement of Stop-Loss orders should be based on the specific characteristics of the flag pattern and the volatility of the asset. - Not Having a Clear Exit Strategy. Traders often focus on entry points but neglect to plan their exit strategy. This can lead to missed opportunities or staying in losing trades for too long.
Avoidance. Determine your profit targets and Stop-Loss levels before entering a trade. Stick to your plan and avoid emotional decision-making. Consider using trailing Stop-Loss orders to capture more significant gains in trending markets. - Ignoring Risk Management. Failing to manage risk appropriately is a common mistake. Traders may allocate too much capital to a single trade or neglect risk-reward ratios.
Avoidance. Always practice rational risk management by determining the size of your position based on your risk tolerance and the distance to Stop-Loss. Use proper position sizing and never risk more than you can afford to lose on a single trade. - Lack of Patience. Impatience can lead to premature entries or exits. Some traders may not give the pattern enough time to develop fully.
Avoidance. Be patient and wait for the flag pattern to mature. Avoid rushing into a trade. If the pattern is not well-formed or does not meet your criteria, it’s okay to skip it. - Overconfidence. When a trader learns what is bearish flag and bullish flag, and has success in a few flag pattern trades, it can lead to overconfidence and taking excessive risks in subsequent trades.
Avoidance. Stay humble and maintain discipline. Overconfidence can cloud judgment and lead to impulsive decisions. Stick to your trading plan and risk management rules. - Not Learning From Mistakes. Failing to review and learn from previous flag pattern trades can hinder your growth as a trader.
Avoidance. Keep a trading journal to record your trades, decisions, and outcomes. Analyze both winning and losing trades to identify patterns and continuously improve your trading strategy.
By avoiding these common mistakes and continuously improving your flag pattern trading skills, you can increase your chances of success in cryptocurrency and other financial markets.

Flags vs. Pennants
Technical analysis patterns include not only bearish and bullish flags but also pennants of the same name. These patterns can often be easily confused due to their similar shapes and signals. Let’s delve into the differences between them.
Flags and pennants do share similarities, as they both feature visual elements such as parallel trend lines and a comparable pattern shape.
A flag typically forms in the direction of the current trend, whether it’s upward (bullish flag) or downward (bearish flag). The flag has the shape of a vertical line representing rising or falling prices (the flagpole), with sloping lines (the flag itself) connecting the minimum or maximum points of price movements. The flag serves as a signal pattern, indicating a temporary pause in the current trend and hinting at its likely continuation in the same direction. When observing a flag, traders typically anticipate prices returning to the previous trend pattern.
Similarly, a pennant also forms in the current trend’s direction, whether upward (bull pennant) or downward (bear pennant). The pennant adopts a triangular shape, featuring a narrowing price range between two sloping trend lines. Unlike the flag, a pennant has a smaller flagpole, and it is typically followed by a short period of consolidation. The pennant, like the flag, serves as a signal pattern, signifying a temporary pause and suggesting a resumption of the current trend after the pennant breaks out. Traders anticipate prices emerging from the pennant with increased volatility.
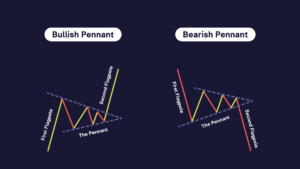
As you can see, both patterns have similar signals but differ in their shape on the chart.
Bull Flag vs. Bear Flag Summary
| Criteria | Bull Flag | Bear Flag |
| Prior Trend | Upward | Downward |
| Formation | After a strong price increase | After a significant price decline |
| Flagpole | Represents the initial strong price move | Represents the initial sharp price drop |
| Flag Structure | Sideways or slightly downward | Sideways or slightly upward |
| Entry Point | Usually, when the price breaks above the upper boundary of the flag | Usually, when the price breaks below the lower boundary of the flag |
| Price Target | Estimated by measuring the flagpole’s length and adding it to the breakout point | Estimated by measuring the flagpole’s length and subtracting it from the breakout point |
| Trading Strategy | Considered for Long (buy) positions | Considered for Short (sell) positions |
| Risk Management | Place a Stop-Loss below the flag pattern | Place a Stop-Loss above the flag pattern |
Use Bull and Bear Flags With Care
Remember that flag patterns are just one aspect of technical analysis and should be used with other indicators and analysis methods to make informed trading decisions. Additionally, past performance is not indicative of future results, so it’s important to manage risk and trade responsibly.
Conclusion
Flags are a powerful tool for analyzing the cryptocurrency market, enabling traders and investors to spot potential price fluctuations and make well-informed decisions. Nonetheless, it’s important to remember that flags can sometimes produce false signals and may not always provide accurate indications. Therefore, it is advisable to complement their use with other analysis methods and incorporate effective risk management strategies.
FAQ
A bear flag pattern is a technical analysis chart pattern. This pattern occurs after a significant decline in prices, followed by a period of stabilization. This pattern is considered a reliable downward signal, as it is likely that the initial downtrend will continue after the formation of this pattern is completed.
A bull flag pattern is a technical analysis chart pattern that is considered a continuation pattern and indicates a temporary pause in an uptrend. This pattern is characterized by a sharp and rapid rise in price, followed by consolidation. The pattern is considered a signal that the asset will continue its upward movement.
A flag pattern can be either bullish or bearish, depending on how it looks. A bull flag is characterized by a sharp rise in price followed by a period of consolidation. On the chart, it looks like a flagpole with a flag raised. A bearish flag, on the contrary, is characterized by a sharp decline in price, that is, its flagpole “looks” down.