What Is a Pennant Pattern?

In trading, success often comes down to spotting not just the obvious signals, but also the more nuanced technical analysis patterns that can hint at upcoming price movements. One such formation is the pennant—a continuation pattern that typically emerges during periods of sharp correction or consolidation. In this article, we’ll explore how to identify pennants and apply them effectively in cryptocurrency trading.
Trade cryptocurrency on WhiteBIT
Understanding the Pennant Chart Pattern
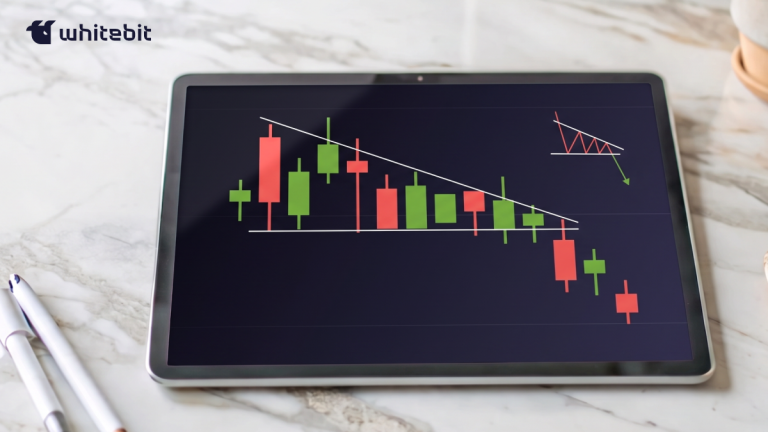
A pennant is a technical analysis pattern that emerges when an asset’s price consolidates within a tightening range, forming a shape that resembles a small flag or pennant. This formation typically indicates a continuation of the prevailing trend following a brief consolidation or pullback.
Pennants can develop in both bullish and bearish markets. A bullish, or ascending, pennant forms within an uptrend and often signals further upward momentum, while a bearish, or descending, pennant flag pattern appears in a downtrend, pointing to a likely continuation of the decline.
The pattern generally arises after a sharp price movement, during which the market pauses for a correction before resuming its initial direction and breaking out above or below the pennant’s boundaries. While often compared to triangles, pennants differ in several key aspects: their trendlines are less rigid and more fluid, giving the formation a more dynamic appearance. Unlike symmetrical triangles, which narrow evenly, pennants typically feature looser, less symmetrical boundaries, reflecting the adaptive nature of market conditions.

Bullish and Bearish Pennants
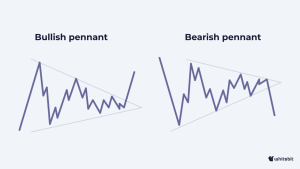
In trading, pennants are typically classified into two main types that signal a continuation of the prevailing trend: bull flag pennant and bearish. Each has distinct characteristics and points to the likely direction of price movement once the pattern is confirmed.
- Bullish pennant: This formation appears during an uptrend, usually after a sharp rally followed by a brief consolidation or pullback. A breakout above the bull pennant pattern upper boundary often serves as a buy signal, suggesting that the market is poised to resume its upward trajectory.
- Bearish pennant: This bear pennant pattern develops within a downtrend, following a short-lived consolidation after a strong move lower. A breakout beneath the lower boundary typically signals continued downside momentum, providing traders with a potential sell opportunity.

Flag vs Pennant Pattern
Although flags and pennants share similar trading principles, they differ in structure, consolidation behavior, and duration of formation:
- Shape: A flag pennant pattern forms as a parallel channel that slopes counter to the prevailing trend. A pennant, by contrast, takes the shape of a small, converging triangle, with its boundaries narrowing toward one another.
- Consolidation: In a flag, price action typically moves sideways or slightly against the main trend. In a pattern pennant, consolidation occurs within a tightening range, aligning more closely with the direction of the dominant trend.
- Duration: Flags are generally shorter-lived, forming within a few days to a couple of weeks, while pennants tend to develop over a longer span, typically lasting one to three weeks.

What Is the Doji Candle Pattern and How to Use It in Crypto Trading?
Read the articleTechnical Analysis with Pennant Patterns
In technical analysis, the pennant pattern is viewed as a continuation signal, typically appearing after a period of consolidation or a short pullback within the prevailing trend. Trading this pattern requires a disciplined approach, as success often hinges on factors such as trading volume, breakout confirmation, and confluence with other indicators.
One of the most critical elements in confirming a pennant breakout is volume behavior. During the formation of the pattern, trading volume usually contracts, reflecting reduced market activity. A valid breakout is then confirmed when volume surges sharply in the direction of the breakout. On candlestick charts, strong candles with large bodies accompanying the move further reinforce the signal. Conversely, a breakout marked by weak volume and small candles may point to a false move, significantly raising the risk of an unsuccessful trade.
To increase reliability, traders should also consider support and resistance levels as well as other technical indicators. A breakout above the pennant’s upper boundary during an uptrend, supported by rising volume, often signals further upward momentum. Conversely, a breakdown below the lower boundary in a downtrend, validated by strong selling pressure, typically indicates a continuation of the decline.
Essential Tools and Indicators to Use with Pennants
For successful pennant trading, it’s essential to combine the pattern with other technical indicators and confirmation tools. One of the most important is trading volume, which should rise noticeably at the moment of a breakout, validating the strength of the move.
Moving averages (such as the SMA and EMA) are useful for confirming the broader trend, but they are less reliable as support or resistance within the pennant itself. During the formation phase, the primary focus should remain on the pattern’s boundaries and trading volume, as these provide clearer, more actionable signals.
Additional confirmation can be gained through indicators like the Relative Strength Index (RSI) and the Moving Average Convergence Divergence (MACD).
RSI helps identify overbought and oversold conditions. If a breakout occurs when RSI is near 70 or 30, it may suggest the risk of a reversal or a false breakout.
MACD is valuable for confirming trend strength and momentum. A bullish breakout gains credibility if the MACD crosses above the signal line at the same time, while a bearish breakout is reinforced when the MACD crosses below it.
Together, these tools enhance the reliability of pennant signals and help traders filter out false moves.
Common Pitfalls and Mistakes to Avoid in Pennant Trading
When trading pennant patterns, traders often fall into several common traps that can undermine their results. One of the most frequent mistakes is ignoring trading volume. A breakout that occurs on weak volume is often a red flag, as it may indicate a false signal rather than a genuine continuation of the trend.
Another critical factor is the duration of the pattern. If a pennant takes too long to form, the probability of a market reversal rises, reducing the reliability of the setup.
A third mistake lies in misjudging price targets. Traders sometimes overestimate the potential move following a breakout or fail to adjust for real market conditions, leading to unrealistic expectations and poorly timed exits.

Trading Strategy with the Pennant Pattern
There are several effective strategies for trading pennant patterns that allow traders to capitalize on trend continuation. Two of the most widely used approaches are the breakout strategy with volume confirmation and the breakout retracement strategy.
Breakout Strategy with Volume Confirmation
The most common approach is to wait for a decisive breakout of either the upper or lower boundary of the pennant. Once the breakout occurs, traders enter positions in the direction of the move. Confirmation through rising volume is crucial, as it validates the strength and sustainability of the breakout.
Depth-of-market (DOM) analysis can further enhance this strategy by showing the distribution of buy and sell orders across price levels. For example, in a bullish pennant pattern, a breakout above the upper boundary—accompanied by higher volume and significant buy-side interest—signals an opportunity to enter a long position. Conversely, in a bearish pennant, a breakdown of the lower boundary on strong volume with sell-side pressure provides a signal to short.

Breakout Retracement Strategy
In some cases, the price may retest the broken boundary after the initial breakout, forming a retracement. Traders can use this pullback to enter the market at more favorable levels. In practice, this means entering long after a bullish pennant breakout if the price retraces to the newly formed support level, or entering short after a bearish breakout if the price retests resistance. As with the first strategy, confirmation from trading volume and complementary indicators (such as RSI or MACD) is essential for filtering out false signals.

How to Trade Bullish and Bearish Pennants?
Trading with bullish and bearish pennants demands a well-defined strategy and careful attention to critical elements such as entry timing, profit-taking, and risk management. Below, we’ll break down the key aspects of using this pattern effectively in practice.

Entry Points for Bullish and Bearish Pennants
When trading pennants, the core strategy is to wait for a confirmed breakout of the pattern’s boundary. In a bullish pennant, the entry point is triggered when the price breaks above the upper boundary, signaling a likely continuation of the uptrend. Conversely, in a bearish pennant, the entry is made when the price breaks below the lower boundary, indicating that the downtrend is set to continue.
Where to Set Profit Targets for Bullish and Bearish Pennants?
The profit target in pennant trading is typically measured by projecting the height of the pattern’s base onto the breakout point. In the case of a bullish pennant, this distance is added to the breakout level of the upper boundary, providing an estimated upside target. For a bearish pennant, the same distance is subtracted from the breakout level of the lower boundary, indicating a potential downside target. This method gives traders a structured way to set exit levels and manage expectations for the trade.
Optimal Stop Loss Placement in Pennant Trades
A stop-loss in pennant trading is typically placed beyond the opposite boundary of the pattern—just below the lower boundary in a bullish pennant or just above the upper boundary in a bearish pennant. This positioning helps protect against false breakouts and sudden price reversals. The stop-loss should be set far enough to avoid being triggered by minor fluctuations, yet close enough to keep potential losses under control and maintain a favorable risk–reward ratio.
Simplify your investments with Auto-Invest from WhiteBIT
Conclusion
Trading pennants requires discipline and a methodical approach. Success depends on selecting precise entry and exit points while managing risk through well-placed stop-loss orders. When combined with volume analysis and complementary technical indicators, the flag and pennant pattern can become a highly effective tool for identifying continuation signals and improving overall trading performance.