Ascending Triangle Pattern: How It Works

Key Takeaways:
- Ascending Triangle is a bullish chart pattern in which price is capped by a horizontal resistance level while the lows continue to rise.
- Key characteristics: horizontal resistance, ascending support, a narrowing price range, and increasing volume on the breakout.
- The pattern is confirmed when the price breaks above the resistance level.
- The price target is determined by measuring the height of the triangle and projecting it upward from the breakout point.
- Risk: False breakouts can occur, so it is essential to wait for confirmation and apply proper risk management.

Cryptocurrency Market Capitalization
What Is Ascending Triangle Pattern?
An ascending triangle is a chart pattern in technical analysis that forms when the price repeatedly tests the same horizontal resistance level while each successive pullback creates a higher low.

What Are Support and Resistance Levels in Bitcoin and Crypto Trading?
Read the articleHow To Identify An Ascending Triangle?
To identify a triangle ascending pattern on a chart, look for two key trendlines: a horizontal resistance level at the top and a rising support line below. The price tests the same resistance multiple times, while each successive pullback forms a higher low. This signals growing buying pressure, as buyers continue to push the price higher and sellers struggle to maintain the resistance level.
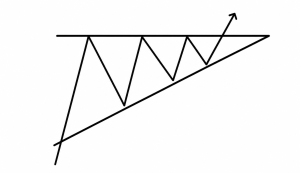
Ascending Triangle
Key Characteristics of an ascending triangle in trading:
- Horizontal resistance: The price repeatedly tests the same resistance level.
- Higher lows: Each successive pullback forms a higher low than the previous one.
- Narrowing price range: The price becomes increasingly compressed between rising support and horizontal resistance.
- Breakout above resistance: The pattern is confirmed when the price breaks above the resistance level.
- Volume: Trading volume often declines as the pattern forms, then typically increases sharply on the breakout.
How To Trade Ascending Triangle Pattern?
The ascending triangle chart pattern is typically traded on a breakout above the horizontal resistance level. As the pattern develops, the trading range narrows: the highs remain capped at the same resistance level while the lows continue to rise.
The classic setup occurs when the price breaks above resistance. After the breakout, the former resistance level may act as support during a retest. The price target is commonly estimated by measuring the height of the triangle – the distance between the resistance level and the lowest point of the pattern – and projecting that distance upward from the breakout point.
It is also important to consider the broader market context. An Ascending Triangle after a downtrend does not necessarily signal a trend reversal. Instead, it may represent a continuation of the corrective move rather than the beginning of a new uptrend. For this reason, traders typically wait for breakout confirmation and evaluate the overall trend before entering a position.
Advantages And Disadvantages Of Ascending Triangle
Let’s consider the main advantages and disadvantages of an ascending triangle:
| Pros | Cons |
| Easy to spot on a chart | False breakouts are common |
| Indicates buying pressure | Does not guarantee a price increase |
| Provides a clear breakout level | Less effective without a trend |
| The target can be estimated based on the pattern’s height | There is a lot of noise on small time frames |
Ascending Vs Descending Triangle Pattern
An ascending triangle crypto indicates that buyers are gradually increasing pressure on the resistance level. Its key characteristics include:
- A horizontal resistance level at the top
- A rising support line at the bottom
- Progressively higher lows
- Price contracting toward the upper boundary
- A pattern that is generally considered bullish
A descending triangle reflects the opposite market dynamic, with sellers gradually increasing pressure on the support level. Its key characteristics include:
- A horizontal support level at the bottom
- A descending resistance line at the top
- Progressively lower highs
- Price contracting toward the lower boundary
- A pattern that is generally considered bearish
Ascending Triangle Vs Rising Wedge
In an ascending triangle, buyers repeatedly test the same horizontal resistance level, whereas in an ascending wedge, the price rises within a narrowing upward-sloping channel, often signaling weakening bullish momentum. Here’s the difference:
Ascending Triangle:
- The upper boundary is horizontal.
- The lower boundary slopes upward.
- Buyers gradually increase pressure on the resistance level.
- Most often results in an upward breakout.
Ascending Wedge:
- Both the upper and lower boundaries slope upward.
- The trading range gradually narrows.
- The uptrend continues, but bullish momentum weakens.
- Most often results in a downward breakout.
Real-time cryptocurrency rates
Conclusion
The main strength of an ascending triangle is that it clearly reflects growing buying pressure at the resistance level. The longer the pattern takes to develop and the more times the price tests the upper boundary, the greater the potential significance of a breakout. Even so, no pattern is reliable without confirmation, and disciplined risk management remains essential.
This content is provided for educational purposes only and does not constitute financial or investment advice.