Rising Wedge Pattern: What It Is and How to Trade It
Key points from the article:
- A rising wedge forms within a narrowing upward range, where price continues to print higher highs, but each successive push shows weaker momentum.
- After a strong rally, the pattern often points to a potential downside reversal. Within a broader downtrend, it may signal that the decline could resume after a temporary pullback.
- The main confirmation comes from a break below the wedge’s lower boundary, ideally with price closing beneath it and, in some cases, retesting the broken trendline.
- Volume, RSI, and MACD can help validate the setup. Falling volume, bearish RSI divergence, and a weakening MACD may all suggest that buying pressure is fading.
- A rising wedge should not be used in isolation. Without broader context, higher-timeframe analysis, volume behavior, and nearby support levels, the risk of a false signal remains high.
Trade cryptocurrency on WhiteBIT
What Is a Rising Wedge Pattern?
A rising wedge is a technical analysis pattern that forms when price moves higher within a narrowing range. The market keeps printing higher highs, but each new push shows weaker momentum, while the lows rise at a faster pace. On the chart, it appears as two upward-sloping trendlines that gradually converge.
How to Identify a Rising Wedge on a Chart?
To read a rising wedge chart pattern correctly, it is important to look not only at the pattern itself, but also at where it forms on the chart.
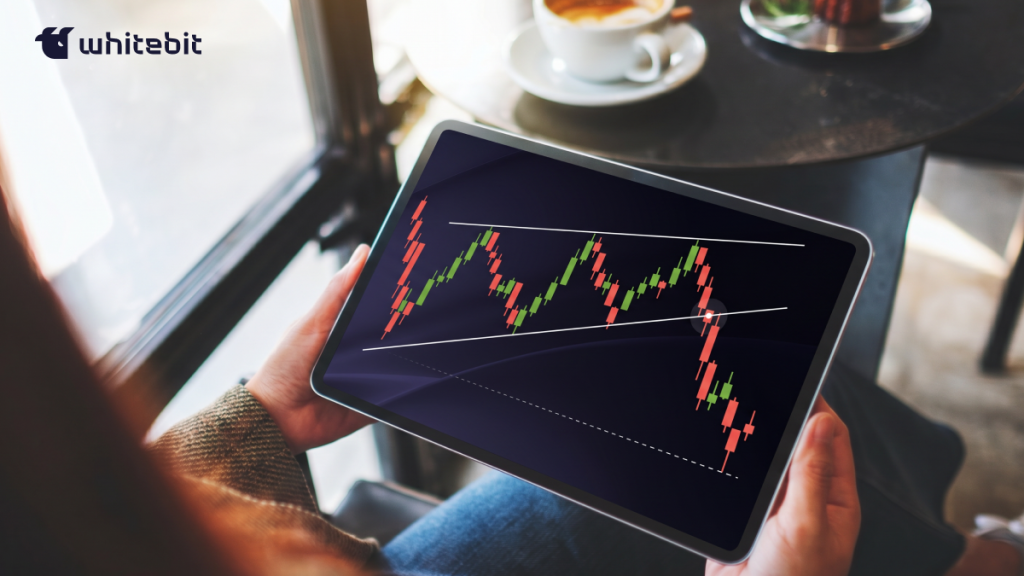
When the pattern appears after a strong rally (rising wedge pattern in uptrend), it is often treated as a potential reversal signal. Price is still moving higher and printing new local highs, but momentum is gradually fading. The range tightens, and buyers can no longer push the market upward with the same conviction. In this context, a break below the lower boundary of the wedge may signal the start of a correction or a broader downside reversal.
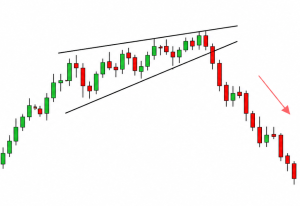
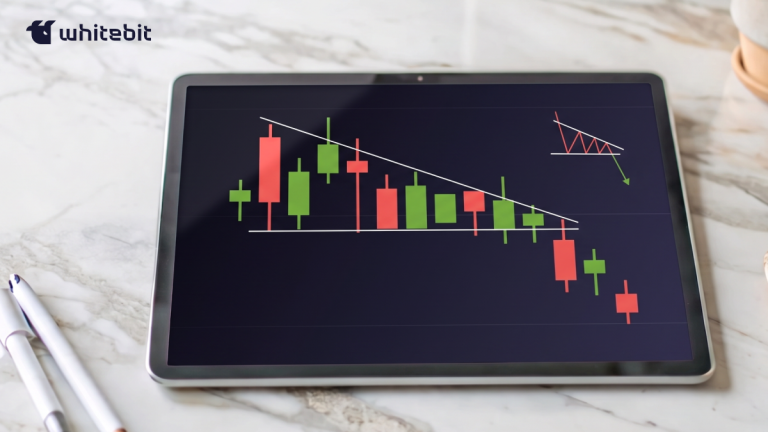
Rising wedge pattern example
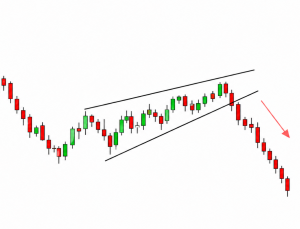
When a rising wedge trading pattern forms within a downtrend (rising wedge bearish), it is more often interpreted as a continuation pattern. In this case, the structure looks like a temporary pullback: price recovers, but without strong demand behind the move. If the market fails to attract fresh buyers, sellers may regain control, and instead of a rising wedge breakout upside, a break below the wedge can point to a continuation of the decline.
How to Trade Rising Wedge Pattern?
It is better to view a rising wedge not as a standalone entry signal, but as part of the broader market structure. First, the trader identifies the pattern itself: price moves upward within a narrowing range, while the support and resistance lines gradually converge. After that, it is important to wait for confirmation, usually a break below the wedge’s lower boundary and a close beneath it.
Key steps when working with a rising wedge:
- Identify the pattern on the chart: price keeps making new highs, but the move becomes less and less convincing.
- Wait for a break below the lower boundary of the wedge, rather than entering a trade simply because the structure “looks like” a wedge.
- Consider entering after a retest of the broken trendline, if price returns to it from below and fails to move back inside the pattern.
- Place a stop-loss above the last local high within the wedge or above the pattern’s upper boundary.
- Estimate the target based on the height of the wedge or the nearest support levels.
- Confirm the signal using volume, a higher timeframe, and the overall market structure.
If the breakout happens on low volume or against a strong market impulse, the risk of a false signal is higher. That is why a rising wedge candlestick pattern should be used together with other analytical tools, rather than as the sole basis for a trade.

Symmetrical Triangle Pattern: A Practical Trader’s Guide for the Crypto Market
Read the articleIndicators for Analyzing an Ascending Wedge
A rising wedge pattern crypto should not be analyzed by its shape alone. To confirm the signal, traders often look at volume, RSI, and MACD. Declining volume inside the wedge may suggest that buyer interest is fading. RSI divergence, where price makes new highs but the indicator does not, points to weakening momentum. MACD can help assess shifts in trend strength: if the signal lines start turning lower or the histogram begins to fade, it may further support the risk of a break below the wedge’s lower boundary. Technical indicators are best used together, rather than treating a single signal as enough reason to enter a trade.
Advantages and Disadvantages of Rising Wedges
Let’s consider the main advantages and disadvantages of an ascending wedge:
| Pros | Cons |
| Clearly indicates a weakening of buying momentum | May produce false breakouts |
| Suitable for identifying a reversal after an uptrend | Not always easy to distinguish from a regular channel |
| Can act as a continuation signal in a downtrend | Requires confirmation by a break of the lower boundary |
| Provides a clear zone for a stop-loss | Without considering volume and context, the signal is weaker |
| Helps anticipate a narrowing of volatility | Less reliable on lower timeframes |
Rising Wedge vs. Other Patterns
A rising wedge is not always easy to distinguish from other patterns. On the chart, it can resemble a channel, a triangle, or a flag. That is why traders should look not only at the direction of price, but also at the structure of the move. In a wedge, price moves higher, but each new push looks weaker, and the range gradually tightens.
If the pattern’s boundaries are almost parallel, it is closer to an ascending channel. If the upper boundary is horizontal while the lower boundary pushes price upward, the structure is more likely an ascending triangle. A bearish flag usually forms after a sharp drop and looks like a short corrective pullback. The key feature of a rising wedge is two upward-sloping lines that converge, showing that buyers are gradually losing momentum.
Track cryptocurrency prices in real time
Conclusion
The main value of a rising wedge is that it helps traders spot a weakening trend before the breakdown happens. The chart may still show upward movement, but inside the structure, the market is already showing signs of pressure: the range is tightening, volatility is fading, and each new high becomes harder to reach.
For a trader, this is not a reason to predict a reversal in advance, but a reason to wait for confirmation and act according to a clear plan.
This material is for informational purposes only and does not constitute financial advice.