Symmetrical Triangle Pattern: A Practical Trader’s Guide for the Crypto Market

Many traders spot the symmetrical triangle trading pattern too late — only after the breakout occurs. An impulsive entry with a tight stop often leads to being stopped out on the first pullback. In reality, this is a liquidity accumulation pattern, not merely a chart formation. In this guide, we’ll walk through how to trade it systematically, from early detection to effective risk management.
Real-time cryptocurrency rates
What Is Symmetrical Triangle Pattern?
A symmetrical triangle is a technical analysis pattern that forms when the price range narrows, with a downward resistance line and an upward support line converging at a single point. This pattern reflects the balance of power between buyers and sellers, accompanied by a gradual compression of volatility. While the symmetrical triangle itself doesn’t predict the direction of the breakout, it suggests a high probability of a strong price movement once the structure is breached.
Unlike a regular triangle, where one side is more pronounced, the symmetrical triangle candlestick pattern has both trend lines converging at the same angle, signaling equilibrium between buying and selling pressure. This means the breakout can occur in either direction. A regular triangle, on the other hand, typically features one dominant side, which may signal a prevailing force and offer more clarity on the breakout direction.

Symmetrical Triangle Pattern Bullish or Bearish
The symmetrical triangle chart pattern doesn’t predict the direction of market movement, but it signals liquidity accumulation and a decrease in volatility. When the price breaks out of the upper or lower boundary of the triangle, it is often followed by a strong impulse, which could either continue the current trend or mark a reversal. Let’s explore two potential scenarios.
Bearish Symmetrical Triangle Pattern
A downward breakout from a symmetrical triangle occurs when the price breaks below the lower boundary, signaling that sellers are gaining control of the market. This type of breakout is typically accompanied by an increase in trading volume, confirming the strength of the move and its potential continuation. It’s crucial to wait for confirmation of the breakout, often followed by a retest of the broken level, which now acts as resistance. Depending on your trading strategy, entry can be made either after the retest or immediately following the breakout.
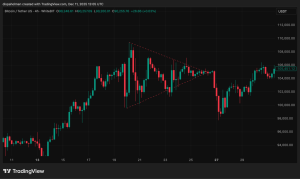
Bearish symmetrical triangle pattern breakout on the BTC/USDT chart. Source: https://www.tradingview.com/
Bullish Symmetrical Triangle Pattern
A bullish breakout happens when the price breaks above the upper boundary of a symmetrical triangle, signaling that buyers are taking control. This suggests the potential for a continuation of the uptrend. As with a bearish breakout, confirmation comes through an increase in volume. After the breakout, you can enter the trade either on a confirming retest of the broken level, which now acts as support, or directly after the breakout. If the market continues in the direction of the breakout, this could signal the start of a stronger upward momentum.
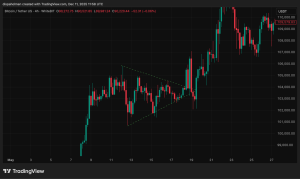
Bullish breakout on the BTC/USDT chart. Source: https://www.tradingview.com/

How to Correctly Identify a Symmetrical Triangle?
Identifying a symmetrical triangle involves recognizing a price pattern that forms during market consolidation, where support and resistance lines converge. To spot the pattern, consider the following:
- Trend Lines: The first step is to identify support and resistance levels: one descending and one ascending. Price action should move between these lines, creating a series of lower highs and higher lows, ultimately forming a triangle.
- Volume: As the symmetrical triangle forms, trading volume typically decreases, reflecting market compression. A significant spike in volume can signal an impending breakout.
- Duration: Symmetrical triangles usually develop over several days or weeks, but the duration can vary depending on the market and time frame. A longer formation often leads to a stronger breakout.
- Indicators: Technical analysis indicators can help confirm the presence of a symmetrical triangle:
- RSI (Relative Strength Index): helps determine if the market is overbought or oversold within the triangle.
- MACD (Moving Average Convergence Divergence): can signal a possible breakout when the MACD lines begin to cross.
How to Trade Symmetrical Triangle Pattern?
Trading a symmetrical triangle requires a clear understanding of the breakout moment and the use of effective strategies to minimize risks. Let’s look at some real strategies that traders use when working with this pattern.
Breakout Strategy
Essence: Wait for the price to break out of the upper or lower boundary of the symmetrical triangle.
- How to use: Once the price breaks through one of the triangle’s boundaries, traders open a position in the direction of the breakout. While it’s possible to enter immediately after the breakout, it’s better to wait for confirmation through increased volume and consolidation above the breakout level.
- Stop-Loss order: Set just beyond the opposite boundary of the triangle or slightly below/above the recent low/high, depending on the direction of the breakout.
- Target: The target is calculated by measuring the height of the triangle and projecting it from the breakout point.
Example: If the triangle forms on a daily chart and the price breaks above the upper boundary, the trader can go long, placing a Stop-Loss just below the lower boundary. The target will be equal to the height of the triangle, projected upwards from the breakout point.
Retest Strategy
Essence: Enter after the price retests the broken level.
- How to use: Once the price breaks through the upper or lower boundary, it may return to the broken level (a retest). If the broken level now acts as support (for a bullish breakout) or resistance (for a bearish breakout), the trader can enter the trade during the retest.
- Stop-Loss order: Set just beyond the opposite boundary or past the most recent local extreme.
- Target: The target is typically the height of the triangle, projected from the breakout point.
Example: After breaking above the upper boundary of a symmetrical triangle, the price may retrace to that level and then bounce higher. The trader can go long during the retest when the breakout level confirms its role as support.
Fakeout Strategy
Essence: Trading against a false breakout.
- How to use: False breakouts occur when the price breaks out of the triangle but quickly returns inside. If this breakout is accompanied by low volume and a swift correction, traders can use it as a signal to trade against the initial move.
- Stop loss: Set just beyond the broken boundary to minimize risk in case the breakout resumes.
- Target: The target is typically based on the nearest support or resistance levels or calculated using standard measurement techniques.
Example: The price breaks below the lower boundary of a symmetrical triangle but quickly returns inside the pattern. The trader can enter a long position, anticipating the price will move back towards the upper boundary of the triangle.
Divergence Strategy
Essence: Using divergence with indicators to confirm a breakout.
- How to use: Traders use indicators like RSI or MACD to spot divergence between the price action and the indicator. For instance, if the price forms new lows (in a bearish triangle), but the RSI shows higher lows, it may signal weakness in the trend and a potential reversal upon breakout.
- Stop-Loss: Set just behind the last local high or low.
- Target: The target is typically determined by the height of the triangle or the nearest support/resistance levels.
Example: If the price forms new lows within a symmetrical triangle, but the RSI shows higher lows, the trader can anticipate an upward breakout confirmed by the divergence.
Volume Confirmation Strategy
Essence: Using volume to confirm a breakout.
- How to use: A breakout from a symmetrical triangle is often accompanied by a sharp increase in volume. If the breakout occurs without a volume surge, it may indicate a false move. Traders wait for volume confirmation as the price exits the triangle, which validates the strength of the breakout.
- Stop-Loss order: The stop-loss is placed on the opposite side of the breakout to limit risks.
- Target: The target is the height of the triangle, measured from the breakout point.
Example: If the price breaks above the upper boundary of a symmetrical triangle with an increase in volume, the trader can enter a long position, setting the stop-loss below the most recent low.

Pros and Cons of the Symmetrical Triangle
Let’s look at a table with the strengths and weaknesses of a symmetrical triangle:
| Advantages of a symmetrical triangle | Disadvantages of a symmetrical triangle |
| Often predicts strong momentum: after a breakout, the price can move quickly. | Does not predict direction: before the breakout, it is impossible to say for sure whether it will be a bullish or bearish breakout. |
| Flexibility: works on all time frames and markets. | Can lead to false breakouts: sometimes the price breaks out and then returns inside the triangle. |
| Clear structure: easy to recognize, especially in combination with indicators. | Does not always form: for a triangle to appear, sufficient time and consolidation are needed, and such conditions do not always exist. |
| Suitable for different strategies: you can trade on breakouts, retests, or false breakouts. | Narrowing range: can lead to insufficient liquidity and reduced forecast accuracy in weak markets. |
Pennant Pattern vs Symmetrical Triangle
A pennant is a short-term continuation pattern that typically forms after a strong impulse move. It is a small triangle that appears following a sharp price jump, with its vertices pointing in one direction and narrowing over time. The volume gradually decreases as the pennant forms and then increases when the breakout occurs in the direction of the previous impulse. It often signals a continuation of the current trend and is used by traders to enter on the breakout with volume confirmation. This pattern is generally short-term and appears on shorter timeframes, making it appealing to active traders.
In contrast, a symmetrical triangle is a more neutral pattern that forms over a longer period. It is a consolidation pattern where the trendlines converge, and the price moves within these boundaries, creating equal angles. Unlike the pennant, the symmetrical triangle does not provide a clear indication of trend continuation or reversal until the breakout happens. After the breakout, the market can move in either direction, and it is the breakout itself that signals the entry point. This pattern can form over several days or even weeks, and the likelihood of a successful breakout depends on volume and the time spent forming the pattern.
List of cryptocurrencies by market capitalization
Conclusion
Forecasts based on a symmetrical triangle can be successful when approached with attention to detail and adherence to trading rules. A breakout from the triangle often results in a strong impulsive movement, and a well-executed strategy, confirmed by volume and other indicators, can significantly enhance the probability of a profitable trade.