What Is Trading Volume in Crypto: A Practical Guide for Traders

In the world of crypto trading, price alone tells you little. The true power behind any price movement is reflected in the volume of cryptocurrency transactions driving it. But what does volume mean in crypto? How can it be calculated accurately and integrated into a trading strategy? Which technical analysis indicators can help analyze volume and differentiate a genuine trend from mere market noise? This article will answer these questions.
List of cryptocurrencies by market capitalization
What Is the Volume in Trading?
Trading volume is an indicator that represents the total amount of an asset (such as Bitcoin, Ether, or any other cryptocurrency) bought and sold on an exchange within a specific time frame. In simple terms, it reflects the overall transaction activity: the more participants trade an asset, the higher the trading volume crypto.
The Role of Trading Volume in Crypto Markets
Trading volumes is crucial in the cryptocurrency market, as it helps traders gauge the strength of trends, liquidity, and overall market sentiment. When high volume is paired with price growth, it confirms the movement’s stability, whereas price increases without volume often signal a false breakout. Analyzing crypto trading volume enables traders to spot potential reversal points, identify support and resistance levels, and pinpoint areas of concentrated market interest. By studying volume, traders can differentiate between genuine trends and market noise, leading to more informed and strategic trading decisions.
How to Calculate Trade Volume?
To understand how cryptocurrency trading volume is calculated, it’s essential to consider two key factors: the transaction price and the amount of the asset bought or sold.
The formula is straightforward:
Trade volume = Price × Number of assets.
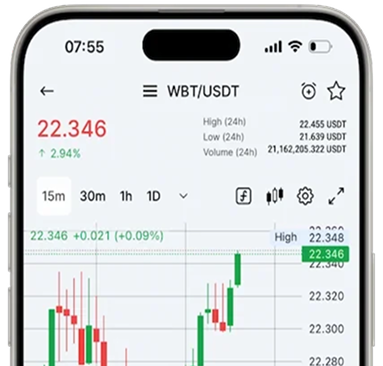
For instance, if a trader buys 2 BTC at a price of $100,000, the trade volume for this transaction would be $200,000. If there were thousands of similar trades throughout the day, the total daily trading volume would be the sum of all these individual transactions. This is the value displayed by exchanges in the “24h Volume” column for each trading pair.
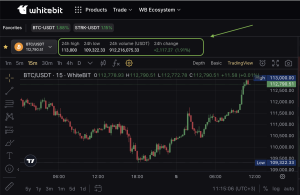
BTC/USDT trading volume on the WhiteBIT exchange
Volume can be measured in both cryptocurrency units (e.g., 1,200 BTC per day) and in fiat currency (e.g., $72 million in the BTC/USDT pair). To make analysis easier, aggregators like CoinMarketCap and CoinGecko provide data on various trading pairs against the US dollar and display the total adjusted volume for each asset.
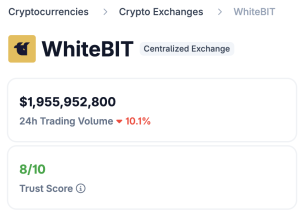
Cryptocurrency trading volume on WhiteBIT. Source: https://www.coingecko.com/
It’s important to note that volume can vary across different exchanges. On larger platforms with higher liquidity, the volume will typically be much higher compared to smaller, less-known exchanges. Additionally, some smaller exchanges may artificially inflate their volume figures through practices like “wash trading,” where transactions are run through their own orders. As a result, professional traders don’t solely rely on raw data but also on adjusted metrics from analytical services to get a more accurate view of the market.

Key Crypto Volume Indicators for Traders
Simply observing the “24h Volume” is not sufficient for making accurate conclusions. Traders rely on specialized volume indicators to analyze the strength of a trend, identify position accumulation, and assess the balance between supply and demand. Let’s take a closer look at some of these indicators:
On-Balance Volume (OBV) — This indicator accounts for price changes relative to the previous period and sums up the volume. If the price closes higher, the volume is added. If the price closes lower, the volume is subtracted. OBV helps determine whether the price movement aligns with the inflow of capital. A price increase accompanied by rising OBV confirms the trend, while a divergence between price and OBV may signal a potential reversal.
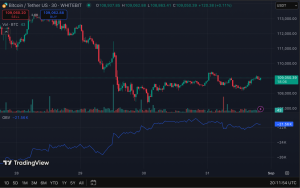
OBV indicator on the Bitcoin/Tether US chart. Source: https://www.tradingview.com/
Accumulation/Distribution (A/D) — Unlike OBV, the A/D indicator considers both volume and the position of the price within the candlestick. If the close is closer to the high, it suggests accumulation (buying). If the close is closer to the low, it indicates distribution (selling). The A/D indicator helps determine which side — buyers or sellers — is currently in control.
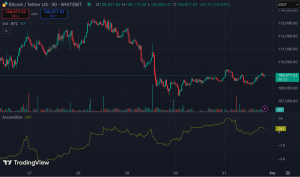
A/D indicator on the BTC/USDT chart. Source: https://www.tradingview.com/
Volume Weighted Moving Average (VWMA) is a type of moving average where each price point is weighted according to the trading volume. Unlike the standard SMA or EMA, VWMA reflects both price movement and actual market activity. A trend confirmed by the VWMA is generally considered more reliable.
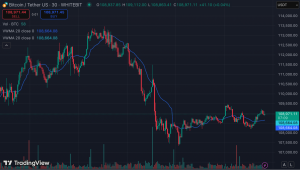
VWMA indicator on the BTC/USDT chart. Source: https://www.tradingview.com/
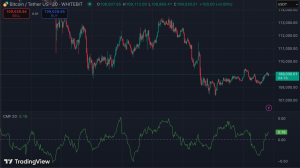
Money Flow Index (MFI) — The MFI, also known as the “money strength index,” is similar to the Relative Strength Index (RSI), but it incorporates volume into its calculation. An MFI value above 80 indicates overbought conditions, while below 20 signals oversold conditions. The MFI is particularly effective for identifying potential reversals and confirming signals from other indicators.
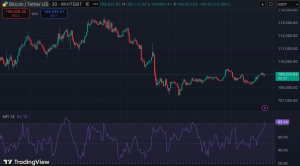
MFI indicator on the BTC/USDT chart. Source: https://www.tradingview.com/
Chaikin Money Flow (CMF) analyzes the flow of capital, with a positive value signaling buying pressure and a negative value indicating selling pressure. It’s useful for spotting divergences between price movements and real interest in an asset.
CMF indicator on the BTC/USDT chart. Source: https://www.tradingview.com/
Footprint Chart — A tool favored by professional traders, the footprint chart shows the distribution of volume within each candlestick. It reveals where large trades are concentrated, helping traders identify the hidden activity of major players that may not be visible on a standard chart.
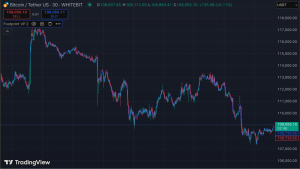
Footprint indicator on the BTC/USDT chart. Source: https://www.tradingview.com/

How to Use Trading Volume in Your Trading Strategy?
As you can see, volume in cryptocurrency is much more than just a number on a chart—it’s a vital tool that helps traders differentiate between strong, sustained movements and random market fluctuations. By incorporating volume analysis, traders can enhance the effectiveness of both short-term and long-term strategies, gaining deeper insights into market trends and making more informed decisions.
Short-Term Strategies: Using Volume for Scalping and Day Trading
In day trading, volume is crucial for filtering out false signals and identifying optimal entry points.
- A sharp increase in volume when a level is broken signals a high probability of continued movement.
- On the other hand, a breakout without volume often points to a “false breakout” and suggests a potential pullback.
Volume also allows traders to quickly assess market liquidity, helping them avoid trades in a “thin market,” where price fluctuations can be more erratic and unpredictable.
Long-Term Strategies: Using Volume for Trend-Following and Position Trading
For swing traders and investors, volume serves as a key indicator of the strength behind broader market trends.
- Volume growth after consolidation signals the beginning of a new trend, confirming the shift in market direction.
- A decrease in volume during prolonged growth suggests a potential loss of momentum, indicating that a reversal may be near.
- High volume at extremes (high/low) often marks the end of a particular phase and signals the transition to a new one, helping traders identify key turning points in the market.

Cryptocurrency Volume Analysis Techniques
There are several ways to analyze the cryptocurrency market through trading volume, but two key methods stand out as especially useful for traders:
- Volume Divergence occurs when price and volume move in opposite directions. For instance, if the price of a cryptocurrency reaches a new high while volume decreases, it indicates that the upward movement lacks strong support and may be on the verge of reversing. Similarly, a price decline without a corresponding increase in volume suggests temporary weakness among sellers. This method helps traders spot weakening movements early and avoid entering false breakouts.
- Volume Climax refers to volume peaks that often occur at market extremes, signaling the end of a trend. A sharp surge in volume at the peak of a rally could indicate that large players are taking profits, suggesting an impending correction. Conversely, a volume spike during a downtrend often points to seller capitulation and signals the start of a potential upward reversal. This approach allows traders to identify key turning points and gauge when a trend may be nearing its end.

Common Pitfalls in Volume Analysis
Volume analysis helps traders gain a deeper understanding of the market, but there are common mistakes that often lead to false conclusions and unprofitable trades:
- Ignoring context. Simply observing a rise or fall in volume without considering the overall market conditions can lead to misinterpretation. The same volume spike can either signal the beginning of a trend or the end — it all depends on the broader market context.
- Blind trust in a single indicator. Relying solely on indicators like OBV or A/D without analyzing price action, support, and resistance levels can lead to mistakes. Volume works best when combined with price analysis and other technical tools.
- Underestimating “false” volumes. Some exchanges artificially inflate volume figures through practices like wash trading. Relying on such data can give a distorted view of liquidity and interest in an asset, leading to poor decisions.
- Premature conclusions. Beginners often react to a surge in volume by immediately opening a position. However, it’s essential to wait for price confirmation before acting — otherwise, you risk falling into the trap of a false breakout.
- Analysis of only short-term intervals. Focusing exclusively on short-term candles (e.g., 5-minute intervals) without considering daily or weekly volumes can distort the analysis. Larger timeframes provide a clearer picture of where significant accumulations or distributions are actually happening.
Pros and Cons of Using Volume Trading
Like any technical analysis tool, volume trading has its advantages and limitations.
| Advantages | Disadvantages |
| Confirms the strength of the trend and helps weed out false breakouts | Does not work in isolation without taking into account price and other indicators |
| Helps find reversal points (volume peaks, divergences) | May give delayed or conflicting signals |
| Provides insight into liquidity and interest in an asset | Data may be distorted (wash trading, volume manipulation) |
| Versatile: can be used in scalping, swing, and long-term trading | Requires experience and correct interpretation of context |
Test your strategies in volume trading on futures
Conclusion
What is volume in crypto? Trading volume on a cryptocurrency exchange reveals where the true interest of market participants lies. Understanding this tool empowers traders to make more confident and informed decisions. Want to learn how to apply volume analysis in practice? Start tracking trading volume on cryptocurrency exchanges today, and you’ll notice how your market perception sharpens and your trading decisions improve.