What is Depth of Market?

Main information
- Depth of market (market depth, DoM) is a table of orders showing the total number of buy and sell orders for each price point for the selected cryptocurrency.
- The market depth consists of buy orders (bids) and sell orders (asks), the asset’s market price, volumes, and order prices for a particular crypto asset.
- DoM allows one to learn about short-term market sentiment and the total number of orders for each price level, determine the liquidity of an asset, and identify price breakouts or reversals.
- Market depth is also used for scalping and intraday trading.
- Disadvantages of the depth chart include the lack of historical data and a broad picture of the market, the possibility of manipulation, the complexity of analysis, and the difficulty of entering and exiting positions.
- DoM is one of the tools for comprehensive analysis of assets and the market.
The cryptocurrency world is full of tools that display the current state of assets and help make trading decisions. Market depth is one of them. Beginners often identify it with the order book, but the depth chart can also give a visual picture of trading conditions. You can read more about what an order book is in our article.
DoM analysis provides additional information about buy and sell orders for an asset. Thanks to it, traders can assess the liquidity of price levels close to the current price and have an insight into the current situation on the market. In addition, the analysis of the market depth allows you to forecast activity in the trading pair in the near future.
What does “depth of market” mean?
The depth of market (DoM) is a chart showing the total number of buy and sell orders for each price level. This allows traders to see the overall liquidity available, assess market sentiment, determine the best time to buy or sell, and learn about the existing supply and demand for a particular asset on the exchange.
What does market depth consists of?
This is a multi-layer chart that displays information about the current market conditions for a particular cryptocurrency and is divided into two sides:
- Bids (orders to buy);
- Asks (sell orders).
The bid side reflects the interest in buying, while the ask side reflects the interest in selling.
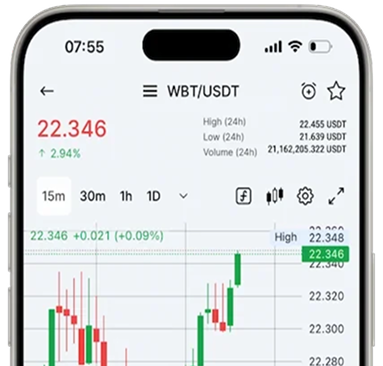
The totality of all orders allows you to see the supply and demand for the cryptocurrency of interest to traders. The point of intersection of the lines of the last sell order and the last buy order is known as the market price — the price at which the last transaction was made. On WhiteBIT, it is indicated by a vertical dotted line. DoM can be found in the WhiteBIT trading terminal by selecting it as one of the price chart display modes (Depth) located above the chart.

Market depth in the WhiteBIT’s trading terminal
The depth chart also displays the total cost of orders. All the information displayed helps traders make decisions by providing them with a picture of current market conditions.
How to read and use the depth of market?
To learn to understand what exactly is happening in the market, you need to be able to read the chart. To get started, you can use market depth analysis to assess the liquidity of an asset, predict its movement in the near future, and determine local support and resistance levels. Here are some examples of DoM analysis:
- Cumulative depth. Some charts include a cumulative depth feature, showing the cumulative number of orders at each price level. This helps to identify support or resistance levels.
- Market mood. If there are more buy orders than sell orders at a certain price level, this may indicate a bullish sentiment. Conversely, if there are more sell orders, this may indicate bearish sentiment. Tracking depth changes can provide valuable insight into market dynamics.
- Pay attention to the gaps in the cost of buying and selling an asset: If they are large, then this may indicate strong volatility and lack of liquidity.
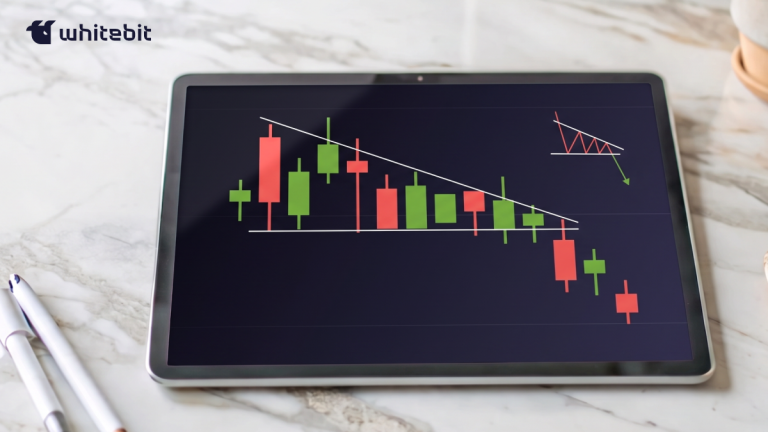
- Breakout and reversal confirmation: DoM can be used to confirm breakouts or reversals in price trends. If there is a significant increase in the volume and activity of orders supporting the direction of the price, this may be the right time to enter or exit a position.
There are many ways to make trading decisions based on order book data, but we suggest starting with a market-depth analysis. With experience, you will find more and more patterns that will help you trade successfully.
Traders use DoM analysis for scalping and intraday trading. They look for price gaps, sudden shifts in order book dynamics, or temporary imbalances in order to make quick trades with small price differences.
What are the disadvantages of the “market depth” tool for analyzing cryptocurrencies?
So, let’s define the disadvantages of this tool:
Complexity. The depth chart at first seems cumbersome and complicated. For the correct interpretation of information, it is necessary to understand the dynamics of the market and the principles of the order book.
Short-term volatility. DoM displays real-time data, meaning the chart data can be very volatile and prone to rapid changes. Therefore, making accurate and timely decisions about opening or closing a position is difficult.
Manipulation potential. Whales (big market players) can place large orders to influence market sentiment or give the wrong impression of supply and demand.
Limited historical data. Depth analysis usually gives an idea of the current state of the market in a short period of time.
Lack of context. While the DoM chart provides valuable information about the current state of the order book, it does not provide the big picture or the fundamentals that can affect price movement.
Due to its features and the existence of other methods for analyzing crypto assets, market depth remains one of the tools for complex analysis. On its own, it cannot provide a complete picture of current market conditions and is used to assess its condition only in a short period.
That is why you need to stick to your trading strategy in everything: carefully examine assets, analyze their price chart thanks to selected tools (for example, market depth) and make decisions based on data, not emotions. And don’t forget to manage risks!
The WhiteBIT blog is constantly updated with new information about trading tools, cryptocurrency analysis methods, and asset reviews.
Use the depth of the market on WhiteBIT to make informed trading decisions!