What Is RSI Indicator (Relative Strength Index)

Key takeaways from the article:
- The RSI gauges whether an asset is overbought or oversold, highlighting potential trend reversal points.
- The RSI is calculated by averaging price changes over a specific period (typically 14 days), providing insight into the asset’s strength.
- A divergence between price and RSI can signal an impending trend reversal.
- RSI settings can be tailored to suit various trading strategies and market conditions.
- In strong trends, RSI can generate false signals, so it’s best used alongside other indicators.
Check current cryptocurrency rates
What Is Relative Strength Index?
The RSI indicator is a technical indicator that measures the speed and magnitude of price movements in the market to assess whether an asset is overbought or oversold. It ranges from 0 to 100 and is typically used to identify potential trend reversal levels.
How RSI Index Works?
The Relative Strength Index (RSI) evaluates an asset’s price based on its fluctuations over a specific time period (usually 14 days) and compares the average gains and losses during that period. The process can be broken down into several stages:
- Data collection: The RSI gathers price data for the asset’s movement over a set period to calculate the rate of price changes. This involves analyzing each closing price on a daily or hourly chart, depending on the chosen settings.
- Calculating price changes: For each period (typically a day or another interval), the indicator measures the price change between the current and previous closing prices. This change can either be positive (an increase) or negative (a decrease).
- Average price change: The indicator then computes the average change in price, considering both the positive and negative changes over the chosen period:
– A positive change occurs if the price rises during the day.
– A negative change occurs if the price falls during the day. - Calculating the Relative Strength (RS) Index: The Relative Strength (RS) is the ratio of the average gain to the average loss over the selected period:
RS = Average Gain / Loss
How Is RSI Calculated?
Once the RS value is calculated, it is used in the RSI calculation. The RSI relative strength index formula is:
RSI = 100/1 + RS
The result is an RSI value ranging from 0 to 100, which helps identify whether an asset may be oversold or overbought.
Plotting Relative Strength Index (RSI)
The RSI updates in real time, continuously tracking current price changes. It looks at the most recent n periods — 14 by default — and uses that data to calculate the current RSI value. When a new price bar appears, such as a new candlestick, the calculation updates as well: the oldest value drops out, and the newest value is added.
Once calculated, the indicator plots a line on the chart that represents the RSI value. This line moves within a range from 0 to 100. The 70 and 30 levels are commonly used to identify overbought and oversold zones, respectively.
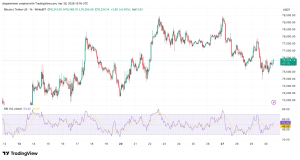
Source: https://www.tradingview.com/
What Is the Best Setting for RSI?
The RSI (Relative Strength Index) can be adjusted in different ways depending on the trading platform and the trader’s strategy. Common RSI settings include:
- Calculation Period (Length/Period). The default RSI setting is 14 periods. This value can be increased or decreased depending on how sensitive the trader wants the indicator to be.
– A shorter period, such as 7, makes the RSI more responsive to price movements but can also produce more false signals.
– A longer period, such as 21, makes the RSI smoother and less reactive, but signals may appear less frequently. - Overbought and oversold levels. The standard RSI levels are 70 for overbought conditions and 30 for oversold conditions. These levels can also be adjusted:
– Some traders use 80 and 20 for stricter signals.
– Others use 60 and 40 in more sensitive markets or when trading strong trends. - Calculation Type (Moving Averages). Some trading platforms allow traders to change the type of moving average used to smooth RSI values. For example:
– An Exponential Moving Average (EMA) may be used instead of a simple moving average to make the indicator react more quickly to price changes. - Smoothing. Traders may apply additional smoothing to the RSI to reduce market noise and make the signal clearer. One common approach is to apply a moving average directly to the RSI line.
- Color and Display Style. Visual settings allow traders to customize the RSI line, such as changing its color to make it easier to read on the chart. Some platforms also allow clouds, zones, or histograms to highlight overbought and oversold areas.
- Timeframe. RSI settings can be adjusted depending on the selected timeframe:
– On a daily chart, the standard 14-period setting is commonly used.
– On shorter timeframes, such as 5-minute or 15-minute charts, traders may use a shorter period, such as 7, to make the indicator more responsive. - Additional indicators and filters. RSI is often used together with other technical indicators, such as MACD, to confirm signals and reduce the risk of false entries.
How to Use RSI in Trading?
Traders often use RSI to identify potential entry and exit points. Some look for buying opportunities when the RSI moves out of the oversold zone, below 30, and consider selling when it moves out of the overbought zone, above 70.
However, RSI is only one indicator, and its signals can be misleading, especially during strong trends. For this reason, traders often combine RSI with other tools or assess it within the broader market context to improve signal reliability.
Divergences are also worth watching. If the asset’s price makes new highs while the RSI fails to do the same, it may suggest that the current trend is losing momentum.

What Are the Advantages and Disadvantages of RSI
The pros and cons of RSI include:
| RSI Pros | RSI Cons |
| Easy to use | Can give false signals in a trend |
| Helps identify oversold and overbought zones | Not always accurate in strong trends |
| Useful for identifying reversal points | Requires confirmation from other indicators |
| Works on different timeframes | May lag in highly volatile markets |
RSI Divergence
Divergence with RSI can signal a potential trend reversal. It can be either bullish or bearish:
Bullish Divergence RSI
- A bullish divergence occurs when the asset’s price makes new lows, while the RSI crypto fails to confirm the move and forms higher lows instead.
- This may suggest that the downtrend is losing momentum and that a potential upside reversal could follow.
Bearish Divergence RSI
- A bearish divergence occurs when the asset’s price makes new highs, while the RSI fails to reach new highs and forms lower highs instead.
- This may indicate weakening upside momentum and a possible downside reversal.

How to Spot RSI Divergence?
To spot divergence, compare price extremes with the RSI. When the price forms a new high or low, but the RSI fails to confirm the move, a divergence appears. This may indicate that the current trend is losing strength and that a reversal could be developing.
Common RSI Pitfalls
Let’s look at a few common mistakes:
- Ignoring the Trend. Many traders use RSI to look for reversals without considering the broader trend. In a strong trend, RSI can remain overbought or oversold for an extended period, producing false signals.
- Using the Standard 70 and 30 Levels in Every Market Condition. The 70 and 30 levels are the default RSI thresholds, but they are not always reliable in strong trends. Some traders use more flexible levels, such as 80 and 20, to filter out weaker signals.
- Lack of Confirmation from Other Indicators. RSI can provide useful signals, but it is more reliable when used alongside other tools, such as moving averages or MACD.
- Ignoring Divergences. Divergences between price and RSI can be strong early signals of a potential reversal. Ignoring them may cause traders to miss important market shifts.
- Lack of Market Context. RSI can generate false signals in highly volatile markets or during sideways price action. Traders should always consider the broader market environment instead of relying on a single indicator.

Trading Strategies Using RSI Indicator Divergence
One popular RSI-based approach is the overbought and oversold trading strategy. When the RSI drops below 30, the asset is considered oversold, and traders may treat this as a potential buying opportunity, expecting a possible upside reversal. When the RSI rises above 70, the asset is considered overbought, which may point to a potential sell or short setup.
However, this strategy should be used alongside other indicators or technical analysis tools to reduce false signals, especially in strong trends. Traders can also use an RSI divergence strategy, where a divergence between price action and the RSI suggests weakening momentum and a possible trend reversal.
Check the current Bitcoin price
Conclusion
The RSI is a useful tool for analyzing market conditions that helps identify when assets are overbought or oversold. However, like any other technical indicator, it can produce false signals, especially during periods of high volatility. The RSI can be used in combination with other analysis methods to make more informed decisions.
The information presented in this article is not financial advice or a recommendation.
FAQ
RSI stands for Relative Strength Index.
RSI is calculated using the formula: RSI = 100 - [100 / (1 + RS)], where RS = Average Gain / Average Loss over a selected period, usually 14 periods.