Engulfing Candle Pattern: Bearish and Bullish Engulfing Pattern in Crypto Trading

The cryptocurrency market rarely offers advance notice — more often, it simply shifts direction. In those moments, signals that reflect real price behavior, rather than lagging indicators, become especially valuable. This is why many traders view the engulfing pattern as a meaningful expression of market intent rather than a derived calculation.

Trade cryptocurrency on WhiteBIT
What Is an Engulfing Candlestick Pattern?
An engulfing formation is a price-action signal in technical analysis where the body of one candle fully absorbs the body of the previous one, indicating an abrupt shift in market initiative. It emerges when either buyers or sellers decisively overpower the prior move, visually capturing a transfer of control and liquidity. In practice, engulfing is better understood not as a classic candlestick pattern, but as the footprint of aggressive volume entering the market and a short-term imbalance between supply and demand.

Difference Between Bullish and Bearish Engulfing Pattern
The distinction comes down to who takes market initiative and where the pattern appears within the broader structure:
- Bull engulfing pattern forms after a decline, when buyers fully absorb the previous bearish candle. This signals a transfer of control to demand and points to a potential upside reversal. When this shift is preceded or accompanied by a pin bar at a key level, it strengthens the case for rejection and highlights early absorption of sell-side liquidity.
- A bearish engulfing candlestick pattern develops after an advance, when sellers completely engulf the prior bullish candle. It reflects supply regaining dominance and raises the risk of a downside reversal as buying momentum fades.
Ultimately, the core difference between bullish and bearish engulfing patterns is not the candle shape itself, but which side seizes control of price — buyers or sellers — and in what market context that shift occurs.
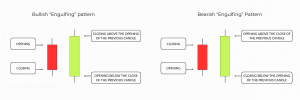
Bullish and Bearish Engulfing Candlestick Patterns

Trading Strategies Using Engulfing Patterns
Below are the core trading approaches that incorporate the engulfing concept, each grounded in market context rather than candle shape alone.
- Reversal from a key level. Engulfing acts as an entry trigger after price reacts to a well-defined support or resistance zone. The position is taken after the engulfing candle closes, the stop is placed beyond its extreme, and targets are set at the nearest liquidity pool or the opposing level. This is the most straightforward and structurally sound application of the pattern.
- Trend continuation (pullback entry). Within an established trend, engulfing is used not as a reversal signal, but as confirmation that momentum is resuming after a correction. Price pulls back into an EMA or consolidation area, then prints an engulfing candle in the direction of the dominant trend — signaling a return of initiative.
- False breakout and range re-entry. Engulfing is particularly effective following failed breakouts. Price briefly moves beyond a level, triggers stop orders, and then forms an opposite engulfing candle, indicating rejection of the breakout. Entry follows the candle close, with targets set toward the range midpoint or the opposite boundary.
- Multi-timeframe alignment. The higher timeframe defines the structural context — trend or key level — while the lower timeframe provides precise entry via engulfing. This approach tightens risk, improves R/R, and preserves the underlying market logic.
Across all scenarios, trading engulfing pattern is never a standalone reason to enter a trade. It serves as a confirmation tool, validating a market narrative that has already taken shape.

Advantages and Disadvantages of Using Engulfing Patterns
Let’s consider the advantages and disadvantages of Engulfing:
| Engulfing Pros | Engulfing Cons |
| Clearly reflects a change in market initiative | Often gives false signals without context |
| Easy to read on all timeframes | Does not work in sideways markets and with low liquidity |
| Allows early entry with a short stop | Requires confirmation by level or structure |
| Versatile for spot and futures | A single candlestick does not indicate the strength of the continuation of the movement |
List of cryptocurrencies by market capitalization
Conclusion
The effectiveness of absorption is determined not by the shape of the candles, but by the conditions of its appearance. The key role is played by levels, market structure, and price reaction, while indicators are used only as an auxiliary tool, whereas the model itself serves as confirmation of an already formed market scenario and a logical conclusion to a trading decision.