Falling Wedge Pattern

Key points from the article:
- A falling wedge is a narrowing price range that slopes downward. The pattern forms between two downward-sloping support and resistance lines that gradually converge.
- The pattern can function both as a reversal pattern and as a trend continuation pattern. After a sharp decline, it often indicates potential seller exhaustion, while within an uptrend, it may signal a corrective phase before the broader upward move resumes.
- The main confirmation of a falling wedge chart pattern is a breakout above the upper boundary. A stronger signal is not merely a break of the trendline, but a candle close above resistance, followed by the price holding above the broken level.
- Volume, retests, and technical indicators help filter out false signals. Rising volume on the breakout, bullish RSI divergence, MACD signals, consolidation above the VWAP, or a reaction from support levels can strengthen the scenario.
- A falling wedge candlestick patternshould not be used as a standalone strategy. It works best when combined with broader market context, higher timeframes, key levels, asset liquidity, and a predefined invalidation zone.
Trade cryptocurrency on WhiteBIT
What Is a Falling Wedge Pattern?
A falling wedge is a technical analysis pattern in which the price moves downward within a narrowing range. On a chart, it looks like two downward-sloping lines: the upper resistance line and the lower support line gradually converge.
Types of Falling Wedges
In technical analysis, there are two main types of falling wedges: reversal and trend continuation. Visually, they look similar, but they form under different market conditions and provide different context.
- Reversal Falling Wedge. This is the classic version of the pattern. It forms after a significant price decline. The market is already in a downtrend, but within the wedge, sellers are gradually losing strength: price continues to make lower lows, but less aggressively, the range narrows, and volatility declines.
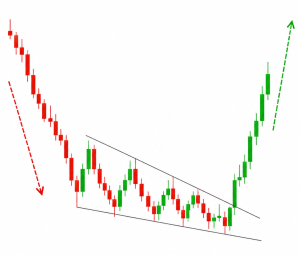
This pattern points to potential seller exhaustion. The price is still moving downward, but the move is slowing. Buyers begin to defend lower levels more actively, while sellers find it increasingly difficult to push the price lower.
- Falling Wedge as a Continuation Pattern. This variation appears during an uptrend. The price rises, then enters a corrective phase and starts moving lower within a narrowing range. At first glance, this may look like weakness, but in reality, the market may simply be cooling off after an impulsive move.
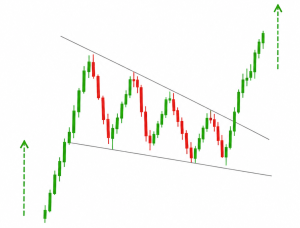
Such a bullish falling wedge pattern often signals a pause before the uptrend continues. Buyers are not leaving the market, and sellers are unable to develop a sustained downtrend. The price corrects, liquidity builds up, weak longs are shaken out, and the asset may then continue moving upward.
How to Trade the Falling Wedge?
A crypto falling wedge pattern should be viewed not as a ready-made signal, but as a market scenario in which price gradually narrows after a decline. Within the pattern, sellers are still testing new lows, but they do so with diminishing momentum. After a breakout above the upper boundary, the market may attempt either a reversal or a continuation of the uptrend.
Context Before the Wedge Forms
The first thing to assess is where the pattern appears. If a falling wedge forms after a significant decline, it is often viewed as a potential reversal pattern. The price is still moving lower, but the amplitude of each swing begins to contract, lows become less pronounced, and selling pressure gradually weakens.
If the wedge appears within an uptrend, it can be interpreted as a corrective structure. In this case, the market temporarily moves lower within a narrowing range before potentially returning to the main trend.
Breakout Above the Upper Boundary
The primary scenario for a falling wedge usually involves a breakout above the upper resistance line. However, a falling wedge pattern breakout is not confirmed by a break of the line itself, as this does not always indicate a full breakout.
A stronger confirmation may come from a candle closing above the upper boundary of the wedge. It is also important to assess whether the price has fallen back inside the pattern or managed to hold above the broken line.
If the price breaks above the upper boundary and continues moving higher, this may indicate a shift in momentum toward buyers.
Volume
Within a falling wedge, volume often declines. This reflects lower market activity and contracting volatility. During an upward breakout, traders usually look for an increase in volume. Rising volume suggests that the move is supported by demand rather than being a random short-term impulse.
If the breakout occurs on low volume, the scenario may be less sustainable, especially in illiquid assets.
Retest After a Breakout
After breaking out of the wedge, the price may return to the broken upper boundary. This is known as a retest. Previously, this line acted as resistance, but after the breakout, it may start acting as support. If the price holds above this zone and turns upward again, the breakout scenario appears more confirmed.
However, a retest does not always occur. In some cases, the price continues moving immediately after breaking out of the pattern.
Scenario Invalidation
For a falling wedge, it is possible to define in advance the zone where the bullish scenario loses validity. A move back inside the wedge after a breakout is usually considered a weak signal. An even more negative scenario is a break below the lower boundary of the pattern, followed by consolidation below it.
In this case, the structure no longer looks like seller exhaustion. On the contrary, the market may signal a continuation of the downward move.
Potential Targets
In the classical approach, the target is often calculated based on the height of the widest part of the wedge. This height is then projected upward from the breakout point. In practice, however, traders may also consider nearby resistance zones, previous local highs, liquidity areas, and the structure of the higher timeframe.
For the crypto market, broader context also matters: Bitcoin’s movement, the state of the altcoin market, volatility, and the liquidity of the specific asset.
Trading Strategies for Falling Wedges
Before moving into the analysis, it is important to clarify that a falling wedge is not a complete trading strategy in itself. It is a chart pattern that can be used as one element within a broader trading system.
- Breakout Entry. The price breaks above the upper boundary of the falling wedge, and traders look for a candle close above the resistance level. This approach is based on the idea that an upward breakout may indicate a shift in momentum toward buyers. A falling wedge is generally viewed as a bullish pattern, confirmed by a move above the upper trendline, preferably accompanied by rising volume.
- Entry on a Retest. After breaking out to the upside, the price may return to the broken boundary of the wedge. In this case, former resistance can be viewed as potential support, while the retest itself may serve as additional confirmation of the move.
- Trend Continuation. If a falling wedge pattern in uptrend forms, it can be viewed as a corrective structure rather than a reversal signal. In this context, an upside breakout often indicates the end of the pullback and a return to the primary uptrend. In professional technical analysis, a falling wedge is considered a pattern that can signal either a reversal or trend continuation, depending on the broader market context.
In all scenarios, volume and potential price targets are also assessed: declining volume within the wedge indicates market contraction, rising volume at the breakout can confirm momentum, and the target is usually estimated based on the height of the widest part of the pattern and the nearest resistance levels.
Indicators to Use with Falling Wedge Patterns
Additional indicators can be used to confirm a falling wedge:
- Volume. Declining volume within the wedge indicates market contraction, while rising volume on the breakout may confirm the strength of the move.
- RSI. Bullish divergence may indicate weakening sellers: the price makes a new low, but the RSI does not.
- MACD. An expanding histogram or a bullish crossover may signal a momentum reversal.
- Moving Averages. These help assess the broader trend, as well as dynamic support or resistance zones.
- VWAP. This is useful on intraday charts: a close above the VWAP after a breakout can strengthen the scenario.
- Support and Resistance Levels. These help identify price reaction zones after a breakout and a possible invalidation of the scenario.

Advantages and Disadvantages of Falling Wedge Pattern
A falling wedge trading pattern helps identify the point at which a downtrend starts to look less convincing. The range narrows, new lows are formed with less momentum, and volatility declines — all of which may indicate gradual seller exhaustion. For traders, the pattern is useful because it has a clear structure: an upper boundary to watch for a breakout, a lower boundary to assess whether the scenario has been invalidated, and a reference point for estimating potential price movement.
However, the falling wedge should not be viewed as a foolproof signal. On lower timeframes and in illiquid assets, it can produce false breakouts, and visually, it is easy to mistake it for a regular descending channel or weak consolidation. Therefore, the pattern’s value is usually higher when it is confirmed by volume, the price reaction to the breakout, nearby levels, and the overall market structure.
Falling and Rising Wedge Pattern: Key Differences
Below are the key differences between a falling and an ascending wedge:
| Criterion | Falling Wedge | Ascending Wedge |
| Pattern Direction | Price declines within a narrowing range | Price rises within a narrowing range |
| What it indicates | Weakening selling pressure | Weakening buying pressure |
| Typical signal | Breakout of the upper boundary | Breakout of the lower boundary |
| Market interpretation | More often a bullish pattern | More often a bearish pattern |
| Confirmation | Increase in volume and consolidation above the broken boundary | Increase in volume and consolidation below the broken boundary |
Track cryptocurrency prices in real time
Conclusion
A falling wedge is often viewed as a bullish falling wedge reversal pattern, but in practice, it requires careful interpretation. Price compression between two descending lines does not, by itself, guarantee a reversal. Context matters: where the pattern forms, whether volume supports the move, how price behaves after the breakout, and whether the trader is being caught in a false breakout trap. In technical analysis, it is not a single pattern that works, but a combination of factors.
This material is for informational purposes only and does not constitute a trading recommendation.